
Figure 4. Biological diversity comparison and enterotypes in healthy controls and all patient samples.
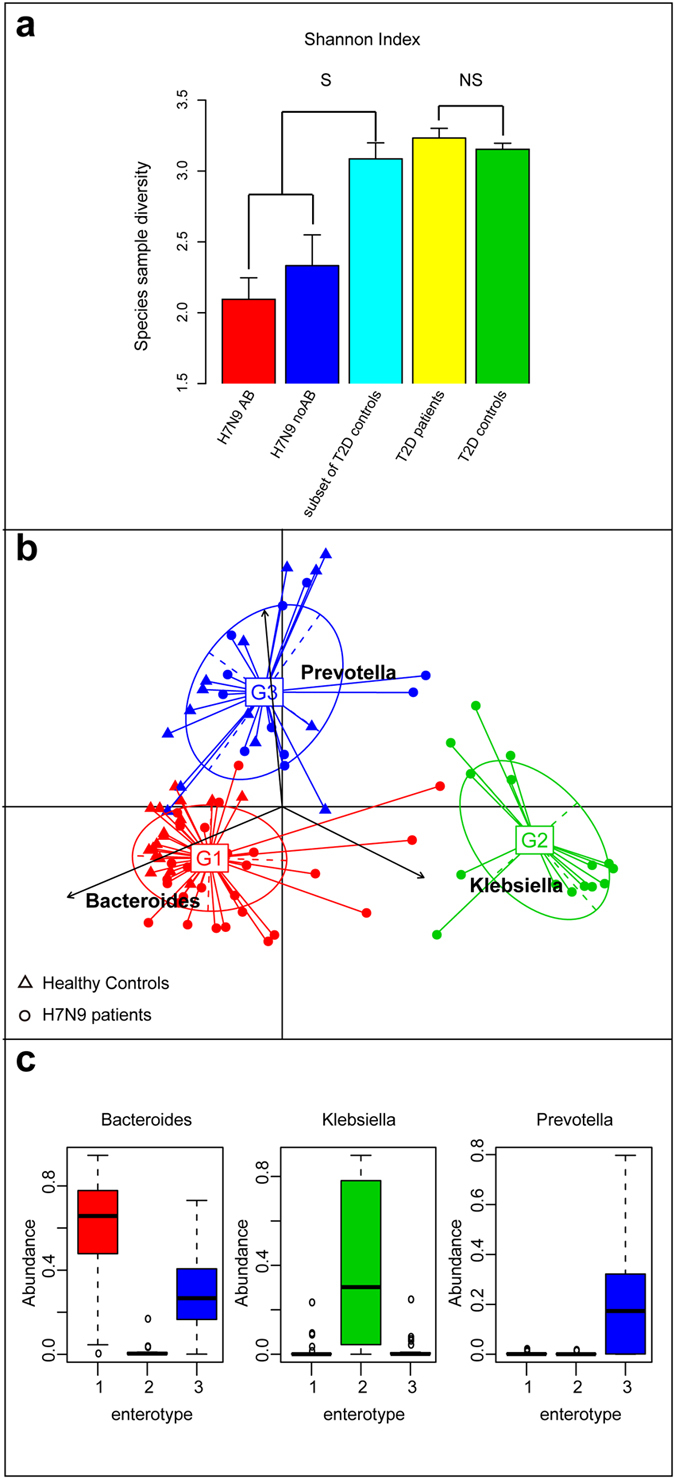
(a) The within-sample diversity (shannonn index) was compared among healthy controls, H7N9 infected patients with antibiotics and without antibiotics; also between T2D patients and controls. The bars denote the within-sample diversity in each group. S, significant; NS, not significant; and the error bar denote standard error. (b) PCA result of three enterotypes in genus level is shown. The clustering of the genus and species compositions of all H7N9 infected patient and healthy controls by mapping the metagenome reads to the reference genome sequences using an 85% similarity threshold. (c) Abundances of the main contributors of each enterotype are shown.The coloured boxes represent the inter quartile range (IQR), from the first and third quartiles, and the line inside represents the median. The circles represent the outliers beyond the whiskers.