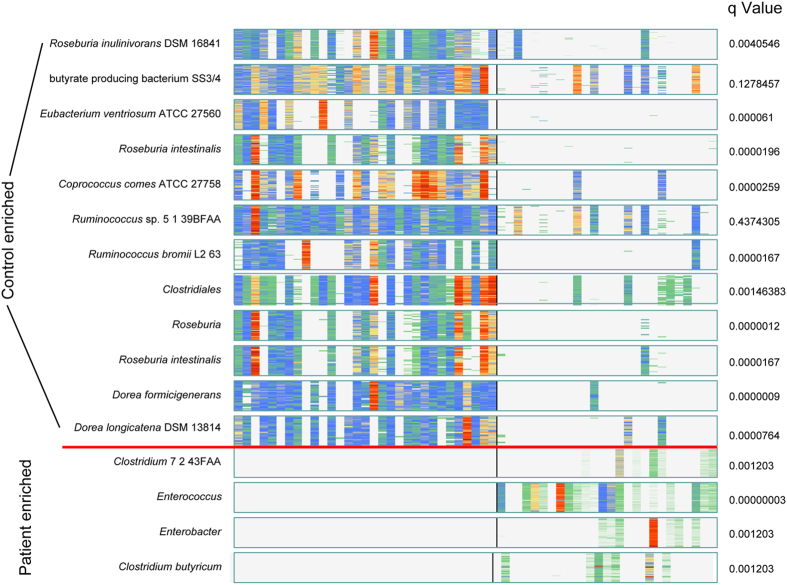
Figure 7. Barcodes of clusters in patient or control group sorted by discriminant significance.
Each “barcode” of the clusters where colors from light blue to dark red indicate abundance from low to high respectively, while white is missing. Each line is a gene, each column is an individual who are ordered by group (left is healthy and right is patient) A healthy enriched B case enriched.

