
Figure 8.
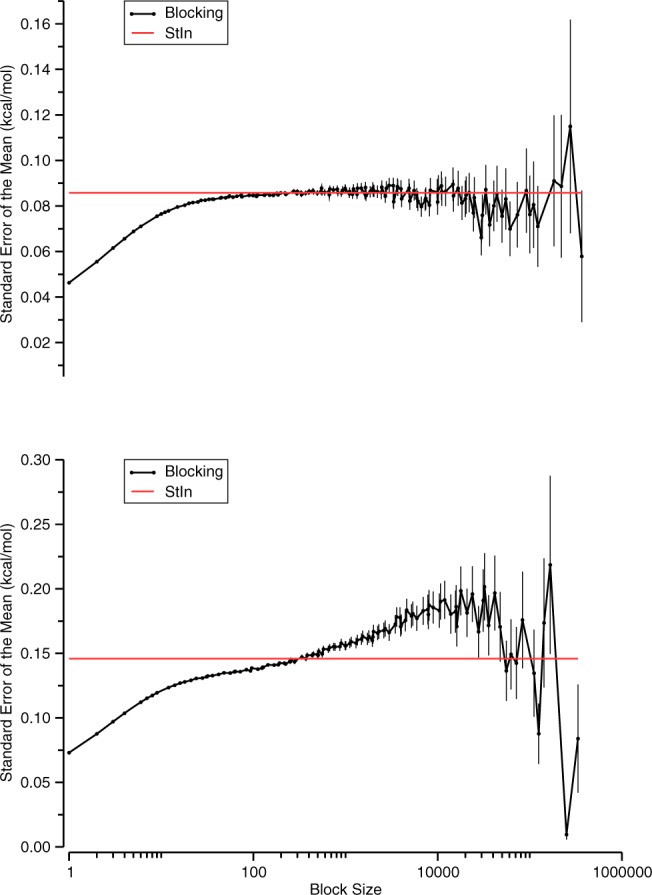
Typical blocking curves for the potential energy of the bound state for a K-ClTemp simulation (top) and a βCD-HexTemp simulation (bottom). Error bars are an estimate of the uncertainty in the SEM; see Flyvbjerg et al.40 for further details. The SEM predicted by the statistical inefficiency method (StIn) is indicated with a red line.