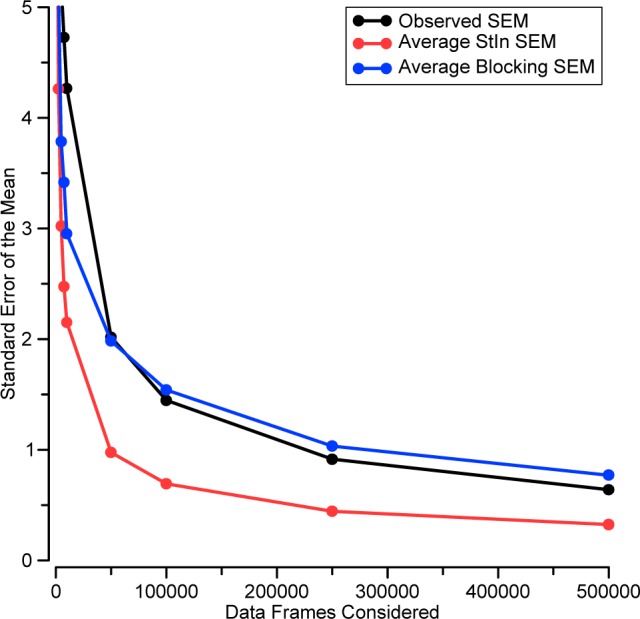
Figure 9.

Comparison of the observed SEM (black) with the average StIn SEM (red) and average blocking SEM (blue) for a data set consisting of 500 artificial simulations, each containing 500 000 correlated data points. The artificial simulations contain similar correlation patterns to those observed for real host–guest data (compare Figure 8, bottom, with Figure S7).
