Fig. 7.

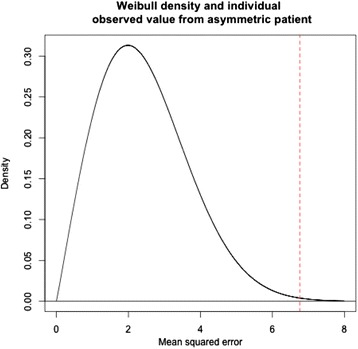
An illustration of an example on how to utilise the Weibull distribution graph created from a dataset of symmetrical subjects. The dotted line illustrates a patient that lies in the 99.8th percentile

An illustration of an example on how to utilise the Weibull distribution graph created from a dataset of symmetrical subjects. The dotted line illustrates a patient that lies in the 99.8th percentile