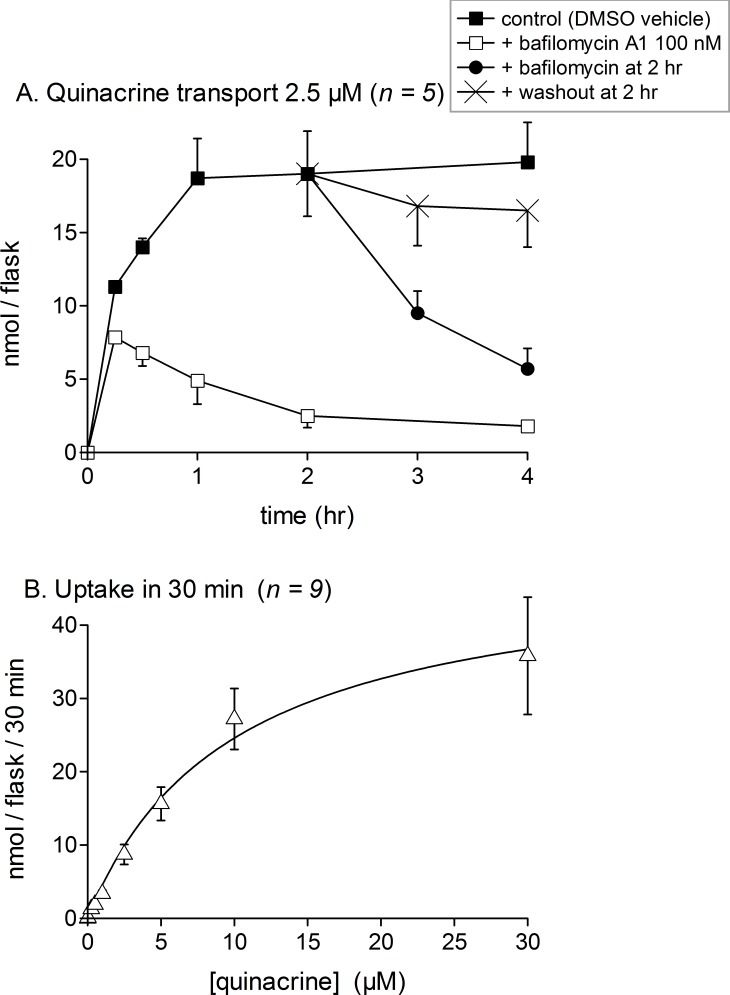
Figure 3. Uptake of quinacrine into confluent C57BL/6 mouse dermal fibroblasts as measured using extract-associated fluorescence.
Each experimental point is derived from a confluent 25-cm2 flask. Values are mean ± s.e.m. of the number of replicates indicated by n. (A) Time course of drug uptake and drug retention upon bafilomycin A1 (100 nM) addition or drug washout for a 2.5 µM drug concentration. (B) Effect of drug concentration on uptake during a 30-min period (described in Results).

