
Figure 1.
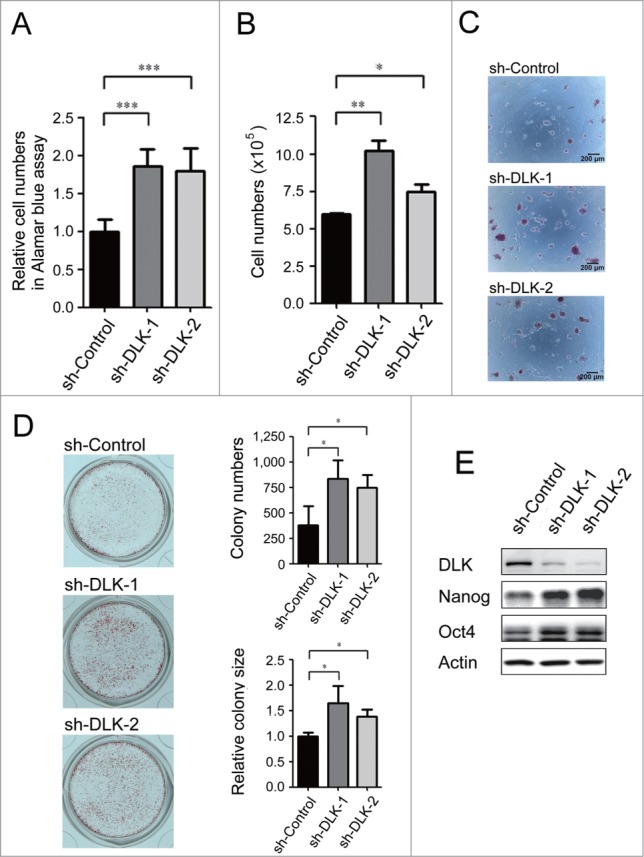
Knockdown of DLK increases mouse ES cell relative cell numbers and expression of Nanog protein. D3 mouse ES cells were transfected with sh-Control, sh-DLK-1 and sh-DLK-2 separately, and selected with 1μg/ml puromycin. (A) Relative cell numbers increased in mouse ES cells transfected with sh-DLKs while compared to sh-control. Relative cell numbers were analyzed by the Alamar blue assay. (B) Absolute cell numbers increased in sh-DLK transfectants while compared to sh-control. Absolute cell numbers were measured by the trypan blue exclusion assay. (C) Mouse ES cells transfected with sh-DLKs had more and larger colonies. The alkaline phosphatase activity was stained and photographed under microscope. (D) Both colony numbers and colony sizes increased in sh-DLK ES cells. Colonies stained with alkaline phosphatase on 24-well plates were photographed and calculated. (E) Nanog and Oct4 proteins were upregulated in sh-DLK ES cells. The expression levels of the indicated proteins were detected by Western blotting. The error bars in the figures represent standard error of the mean (mean±SEM). P values were obtained from 2-tailed Student's t-tests (***, P < 0.0001; **, P < 0.001; *, P < 0.05).