
Figure 6.
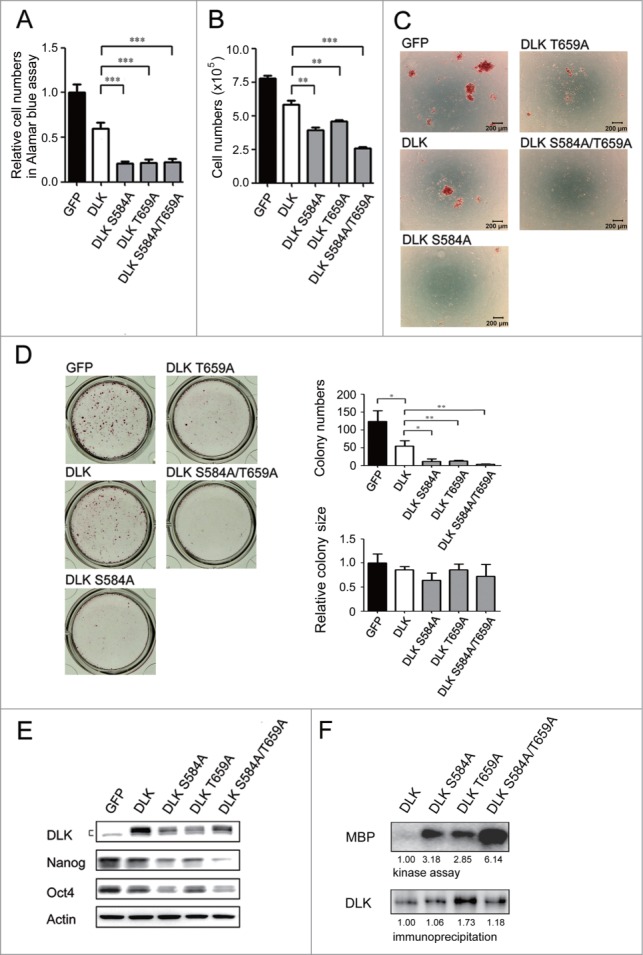
DLK mutated at S584 and T659 significantly reduces mouse ES cell numbers and Nanog expression. D3 mouse ES cells were transfected with GFP, DLK, DLK S584A, DLK T659A, or DLK S584A/T659A. (A) The transfection of DLK S584A, DLK T659A, and DLK S584A/T659A significantly reduced relative cell numbers measured by the Alamar blue assay. (B) Mouse ES cells expressed DLK S584A, DLK T659A, or DLK S584A/T659A displayed significantly reduced cell numbers after counting by trypan blue exclusion assay. (C) Mouse ES cells expressed DLK S584A, DLK T659A, or DLK S584A/T659A dramatically reduced numbers of undifferentiated cell colonies. The alkaline phosphatase activity was stained and photographed under microscope. (D) Colony numbers decreased obviously in mouse ES cells expressed DLK S584A, DLK T659A, or DLK S584A/T659A. Colonies stained with alkaline phosphatase on 24-well were photographed and calculated. (E) Transfection of DLK S584A, DLK T659A, and DLK S584A/T659A DLK downregulated expression amount of Nanog and Oct4. The protein expression levels were detected by Western blotting. (F) DLK mutant at S584A, DLK T659A, or DLK S584A/T659A had higher DLK kinase activity compared to wild type. Wild type DLK and different mutation forms of DLK (DLK S584A, DLK T659A, and DLK S584A/T659A) were expressed, precipitated and aliquoted for Western blotting and kinase assay. In the kinase assay, MBP was used as substrates and the acquired signals were normalized to each precipitated DLKs. The error bars in the figures represent standard error of the mean (mean±SEM). P values were obtained from 2-tailed Student's t-tests (***, P < 0.0001; **, P < 0.001; *, P < 0.05).