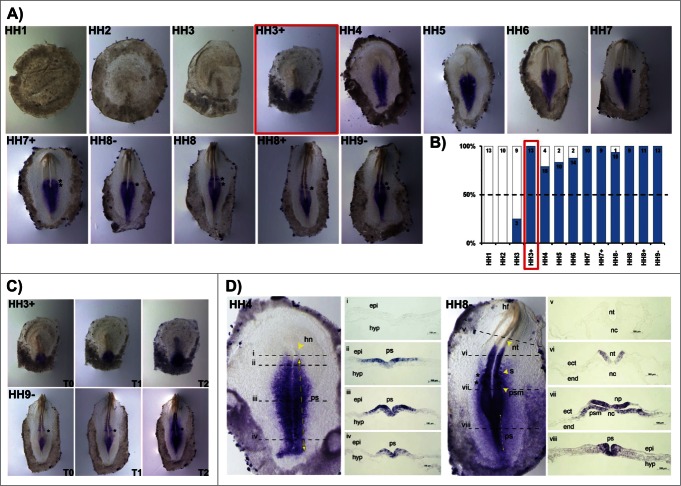
Figure 2.
HoxB2 expression patterns. (A) HoxB2 gene expression by in situ hybridization during early chick development. (B) Representation of the percentage of embryos that display HoxB2 expression. Numbers indicate the experimental N. Red boxes highlight the developmental stage where over 50% of the tested embryos present HoxB2 staining. (C) In situ hybridization images obtained with increasing times of staining, evidencing graded nature of HoxB2 expression. (D) Transverse section analysis of HoxB2 expression patterns in different developmental stages. hn – Hensen's node; ps – primitive streak; epi – epiblast; hyp – hypoblast; hf – head fold; nt – neural tube; s – somite; psm – presomitic mesoderm; nc – notochord; ect – ectoderm; end – endoderm.

