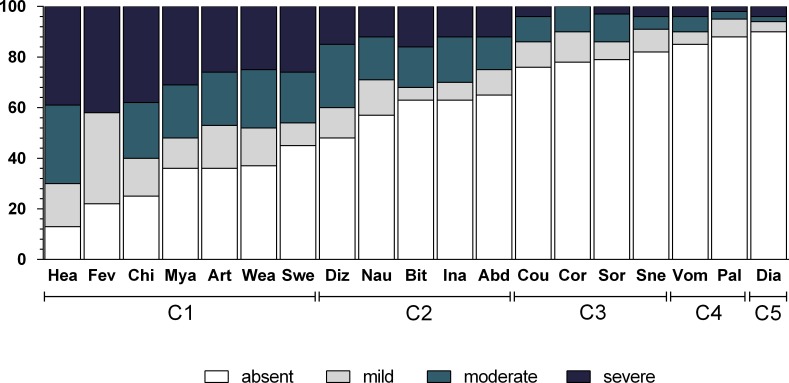
Figure 1. Frequency and intensity of each malaria-related symptom in Mâncio Lima (2012–2013).
Numbers on y axis are percentages. The shading pattern of each bar indicates the proportion of patients reporting a given symptom as absent, mild, moderate or severe. C1, Algic and fever-related symptoms; C2, Gastric symptoms; C3, Respiratory symptoms; C4, Vomiting and pallor; C5, Diarrhoea.

