Figure 1.

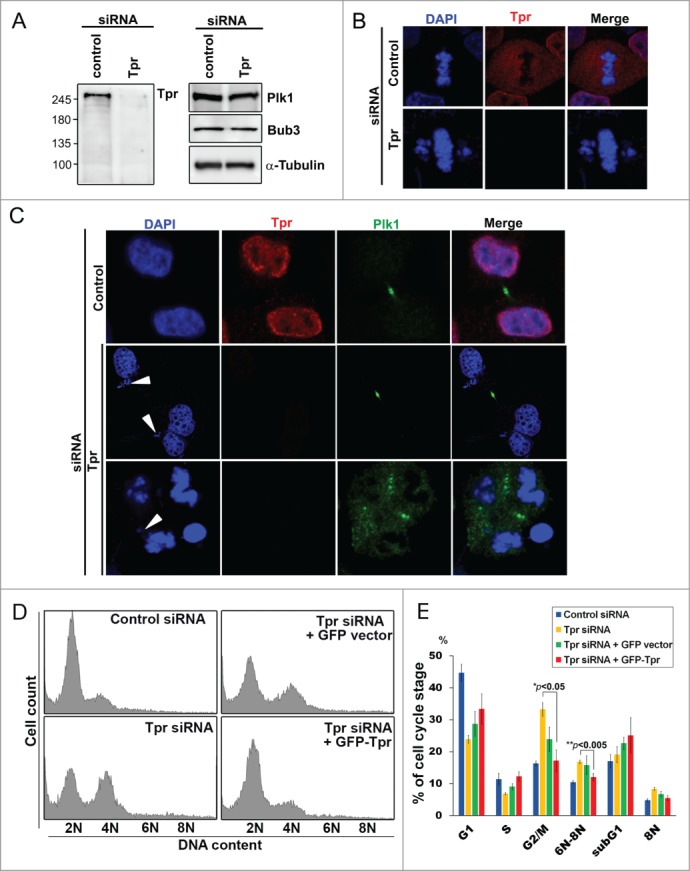
Tpr depletion induces mitotic catastrophe and enhances polyploidy. (A) HeLa cells were transfected with control siRNA or siRNA specific for Tpr (Tpr RNAi). Seventy-two hours post transfection, lysates of Tpr RNAi or control siRNA cells were analyzed by immunoblotting with the antibodies specific for Tpr (mouse anti-Tpr, sc-101294, from Santa Cruz Biotechnology); Plk1 (mouse anti-Plk1, sc-17783, from Santa Cruz Biotechnology) and Bub3 (mouse anti-Bub3, 611731, from BD Transduction Laboratories). The same membrane was stripped and re-probed with anti-α-tubulin [mouse α-tubulin (DM1A)T9026 from Sigma-Aldrich] (as loading control). Numbers indicate molecular mass markers in kilodaltons. (B) Confocal images of mitotic HeLa cells transfected with control or Tpr siRNA and analyzed 72 h post-transfection. Cells were analyzed by immunofluorescence using antibodies against Tpr (rabbit anti-Tpr, sc-67116, from Santa Cruz Biotechnology). Goat anti-mouse Alexa Fluor-488 or rabbit Rhodamine were used as secondary antibodies. DNA was counterstained using DAPI. (C) HeLa cells transfected with control or Tpr siRNA and analyzed 72 h post-transfection. Confocal images of multi-nuclei and polyploid cells that were often found after Tpr depletion, but not in control cells. Cells were stained and were analyzed by immunofluorescence using antibodies against Plk1 (mouse anti-Plk1, sc-17783, from Santa Cruz Biotechnology) (a telophase/cytokinesis marker) and Tpr (rabbit anti-Tpr, sc-67116, from Santa Cruz Biotechnology). Goat anti-mouse Alexa Fluor-488 or rabbit Rhodamine were used as secondary antibodies. DNA was counterstained using DAPI. White arrow heads indicate lagging chromosomes. (D) Ninety-six hours post-transfection with control or Tpr siRNAs, the cell-cycle profiles of HeLa cells were examined by flow cytometry. A control siRNA profile is shown (top, left). (E) Percentage of cells in cell-cycle phases after flow cytometry analysis. Asterisks indicate significant p values (*p < 0.05 or **p < 0.005).
