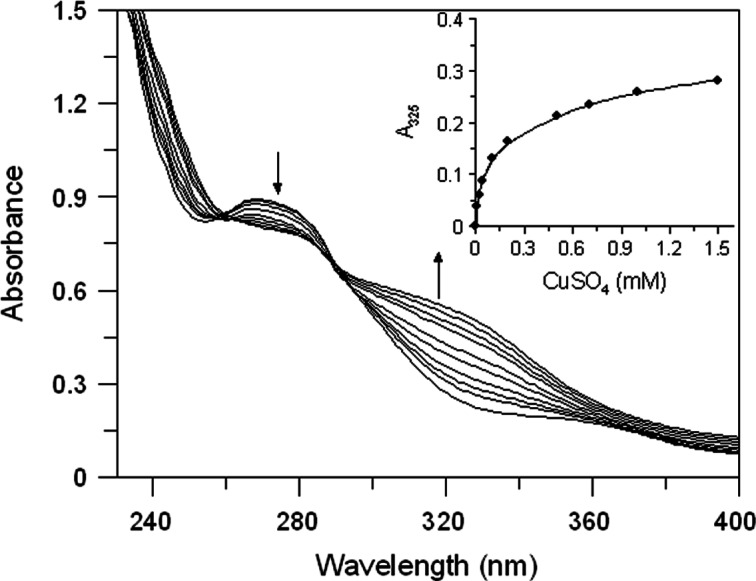
Figure 3. Effect of copper ions on E. characias ethanolic leaves extract.

Absorption spectra of EEL in presence of various concentration of copper ions. Arrows indicate the decrease in absorbance at 265 nm and the contemporary increase in absorbance at 325 nm, after CuSO4 addition. Inset: increase of absorbance at 325 nm vs CuSO4 concentation.
