
Figure 5.
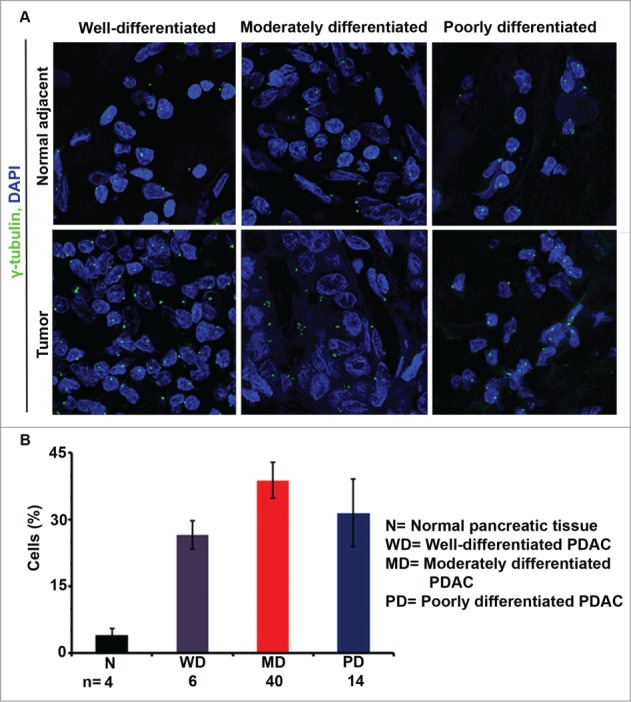
Centrosome amplification (CA) in pancreatic ductal adenocarcinomas (PDACs) and normal pancreatic tissue. Representative confocal micrographs depicting centrosomal profiles in well-, moderately, and poorly differentiated PDACs and adjacent normal pancreatic tissue. Centrosomes were immunostained (γ-tubulin, green) and nuclei were counterstained with DAPI (blue). (B) Bar graph representation of the percentage of cells showing CA in well-, moderately, and poorly differentiated PDACs and normal pancreatic tissue samples. ∼500 cells were counted in each case.