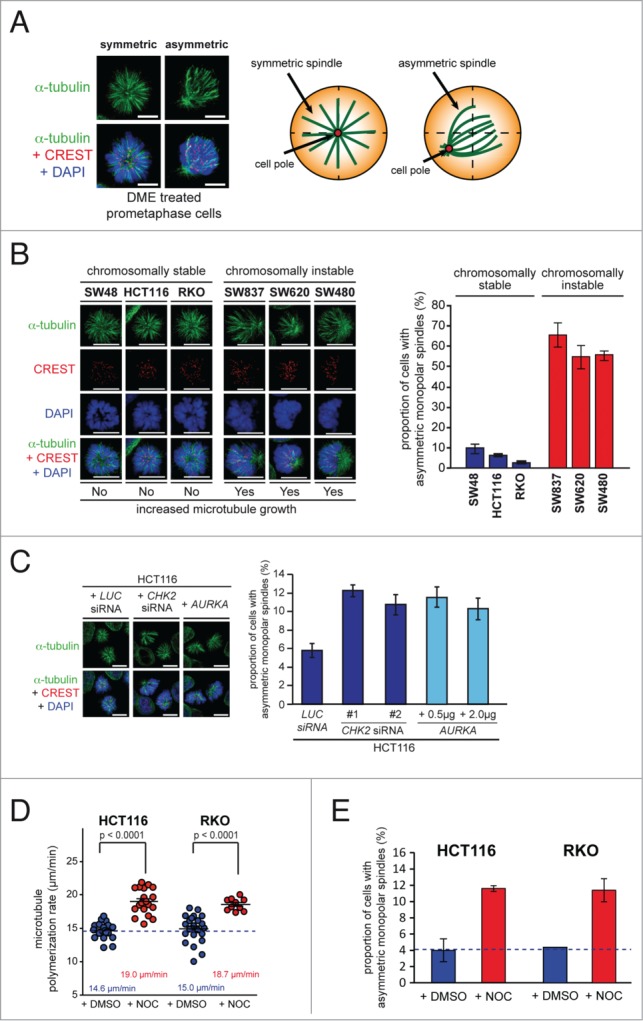
Figure 1.

Chromosomally instable cancer cells with increased microtubule plus end assembly rates exhibit asymmetric monopolar mitotic spindles after Eg5/Kif11 inhibition. (A) Example images of symmetric and asymmetric monopolar spindles after treatment with Eg5/Kif11 inhibitors (spindles, anti-α-tubulin: green; kinetochores, CREST: red; chromosomes, DAPI: blue; scale bar, 10 μm). (B) Detection and quantification of asymmetric monopolar spindles in chromosomally stable and instable colorectal cancer cell lines after Eg5/Kif11 inhibition. Cells were treated with 2 μM of dimethylenastron (DME) for 3 hrs and monopolar spindles and mitotic chromosome alignment were detected by immunofluorescence microscopy analysis as indicated and quantified (scale bar, 10 μm; mean ± s.d.; 1500–2000 monopolar spindles from 3 independent experiments were evaluated). (C) Detection and quantification of asymmetric monopolar spindles in HCT116 cells after loss of CHK2 or upon overexpression of AURKA. Cells were transiently transfected with siRNAs or with plasmids and monopolar spindle formation was evaluated after treatment with DME as in (B). Scale bar, 10 μm. The graphs show mean values ± s.e.m. and 1500–2000 monopolar spindles from 3 independent experiments were evaluated. (D) Measurements of mitotic microtubule plus end assembly rates in chromosomally stable HCT116 and RKO cells after treatment with 0.125 nM nocodazole. Scatter dot plots show average assembly rates (20 microtubules per cell, mean ± s.e.m., t-test, n = 10–24 cells from 3 independent experiments). (E) Quantification of the proportion of HCT116 or RKO cells exhibiting asymmetrically monopolar spindles after treatment with 2 μM DME and 2.5 nM Nocodazole for 3h (mean values ± s.d.; HCT116: 3 independent experiments with a total of 1400 monopolar spindles; RKO: 2 independent experiments with a total of 500 monopolar spindles).
