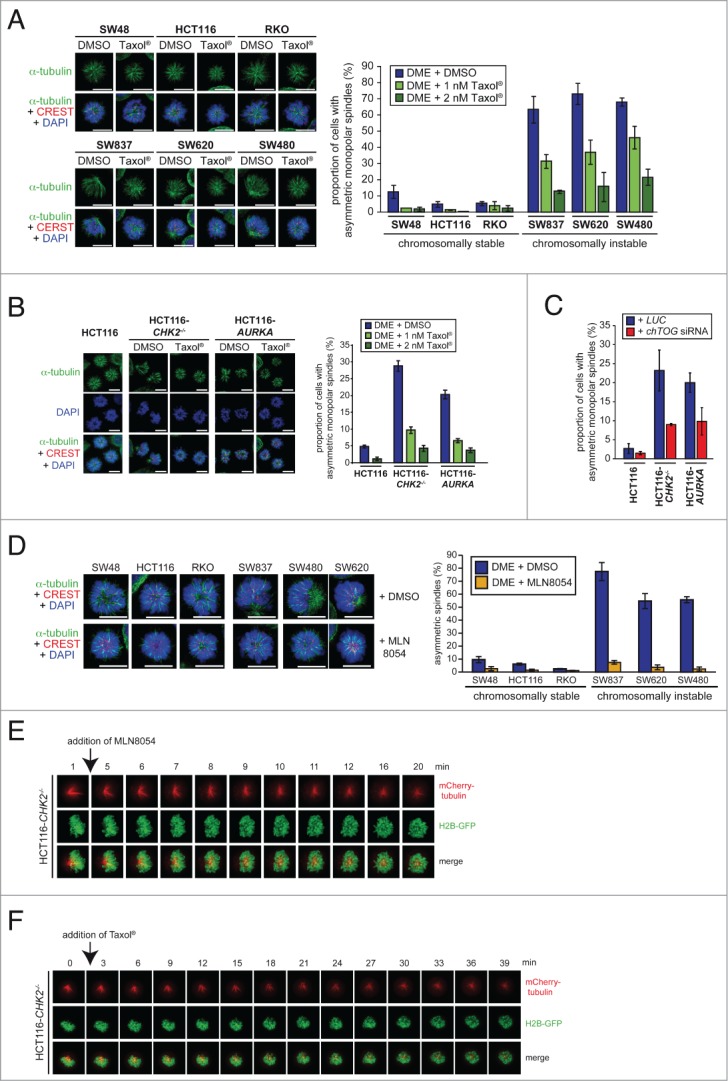
Figure 2 (See previous page).

Asymmetric monopolar spindle formation after Eg5 inhibition is a robust indicator for increased microtubule assembly rates during mitosis. (A) Suppression of asymmetric monopolar spindle formation after restoration of normal microtubule plus end assembly rates by low dose Taxol® treatment. The indicated cell lines were treated with 2 μM DME in the absence or presence of Taxol® and cells with monopolar spindles were quantified by immunofluorescence analysis. Representative images are shown (spindles, anti-α-tubulin: green; kinetochores, CREST:red; chromosomes, DAPI: blue; scale bar, 10 μm). The graphs show mean values ± s.d. and 650–1300 monopolar spindles from 2–3 independent experiments were evaluated. (B) Suppression of monopolar spindle formation in CHK2 deficient or AURKA overexpressing cells after treatment with low doses of Taxol®. Cells were treated as in (A) and the proportion of cells with asymmetric monopolar spindles were assessed by immunofluorescence microscopy and quantified. Representative images are shown (spindles, anti-α-tubulin: green; kinetochores, CREST:red; chromosomes, DAPI: blue; scale bar, 10 μm). The graphs show mean values ± s.d.; 3 independent experiments with a total of 1500 monopolar spindles evaluated. (C) Suppression of monopolar spindle formation in CHK2 deficient or AURKA overexpressing cells after partial loss of ch-TOG. Cells were transfected with siRNAs targeting CH-TOG treated with DME and the proportion of cells with asymmetric monopolar spindles were quantified (mean ± s.d.; 2 independent experiments with a total of 1000 monopolar spindles evaluated). (D) Suppression of asymmetric monopolar spindle formation after restoration of normal microtubule plus end assembly rates by inhibition of Aurora-A. The indicated cell lines were treated with 2 μM DME and 0.5 μM MLN8054 for 2.5 h and asymmetric monopolar spindle formation was assessed. Representative immunofluorescence microscopy images are shown (spindles, anti-α-tubulin: green; kinetochores, CREST: red; chromosomes, DAPI: blue; scale bar, 10 μm). The graphs show mean values ± s.d. (2–4 independent experiments with a total of 430–1680 monopolar spindles evaluated). (E and F) Live cell video image sequences showing HCT116-CHK2-/- cells expressing GFP-tagged histone H2B and mCherry-tagged α-tubulin and treated with 2 μM DME for 2 h and subsequently with 0.5 μM MLN8054 (E) or 2 nM Taxol® (F). Live cell videos according to these images are provided as supplementary videos 1 and 2.
