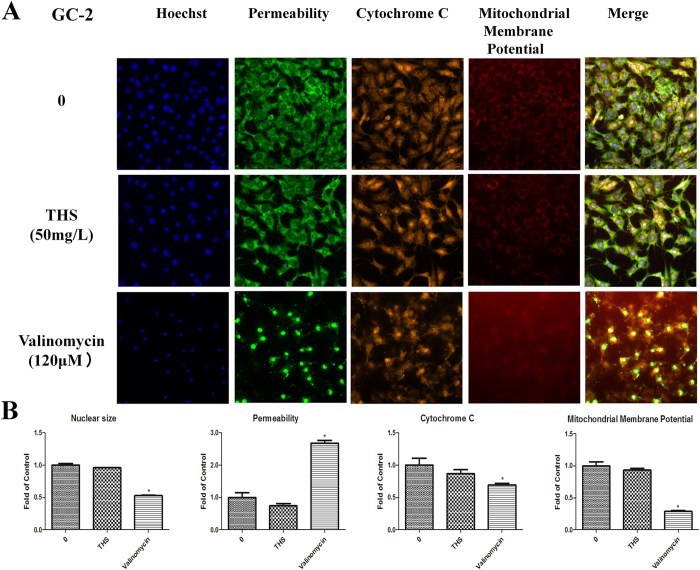
Figure 2. Representative images from the high-content screen after THS exposure in GC-2 cells.
(A) Staining for nuclei (blue), cell membrane permeability (green), cytochrome c (yellow) and mitochondria membrane potential (red). Images were acquired with the ArrayScan HCS Reader with a 20x objective. (B) The relative expressions of nuclear size, permeability, cytochrome c and mitochondria membrane potential. *indicates significant difference when the values were compared to that of the control (p < 0.05).

