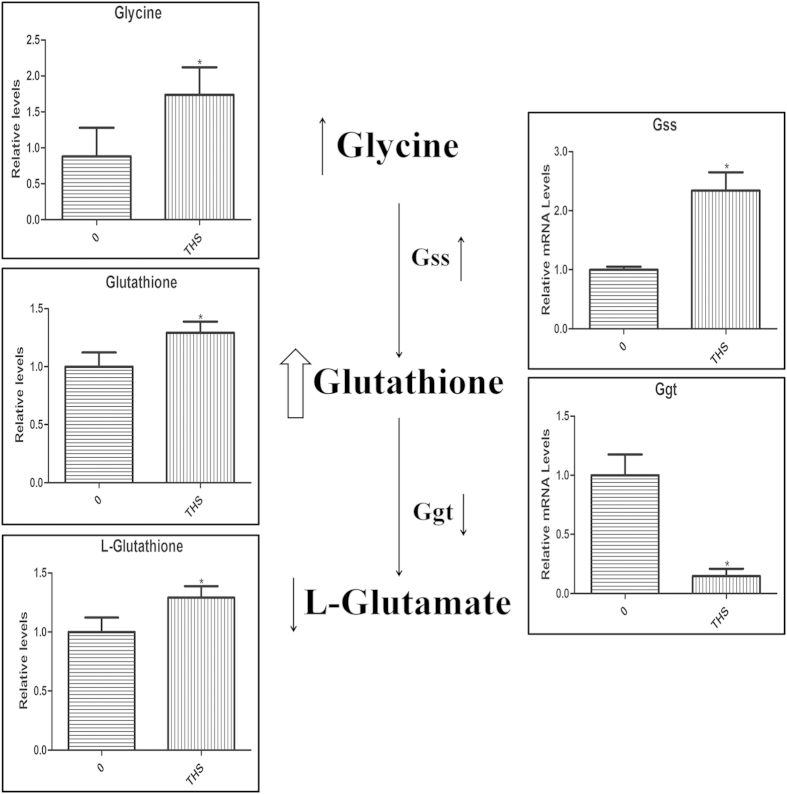
Figure 5. The relative levels of metabolites and metabolic enzyme gene mRNAs in GC-2 cells after THS exposure.
The left panel shows the GC-MS results of levels of metabolites, glycine, glutathione and L-glutamate, in the glutathione metabolism. The right panel exhibits the RT-PCR levels of related metabolic enzyme genes, Gss and Ggt. In the middle, the metabolic pathway of glutathione is depicted schematically. *Indicates significant difference when the values were compared to that of the control (p < 0.05). All tests were performed in triplicate and presented as means ± SE.

