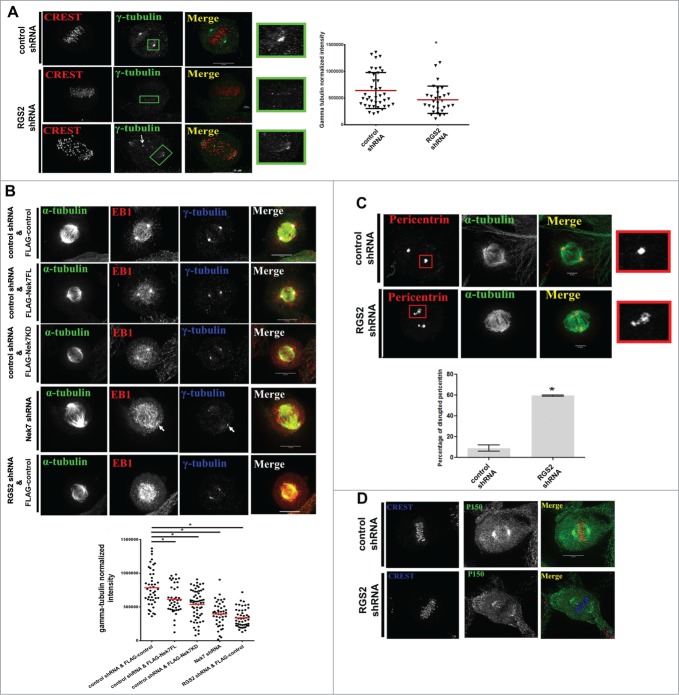
Figure 5.
Nek7 and RGS2 suppression disrupt centrosomes integrity at the spindle poles. (A) Confocal images showing loss of poles γ-tubulin following RGS2 depletion. The arrow indicates punctate γ-tubulin staining. Bar graphs (right) showing the phenotype percentage are representative of 3 independent experiments. n > 30 cells for each experimental group. (B) Immunofluorescence images of mitotic cells showing loss of γ-tubulin from spindle poles (arrow) of cells presenting the indicated treatments. Graphs (bottom) show the phenotype percentage and are representative of 3 independent experiments. n = 25/ experimental group. (C) Confocal images showing the pericentrin disruption following RGS2 depletion. Bar graphs (bottom) showing the phenotype percentage. Data were obtained from 3 independent experiments. n> 20 cells for each experimental group. Insets on the right show higher magnification of centrosomal regions stained with γ-tubulin in (A) or pericentrin in B. *P < 0.05 by Student′s t-test; error bars show standard deviations. (D) Immunofluorescence images of mitotic spindles show a p150Glued loss at the pole in RGS2-depleted cell compared to control.

