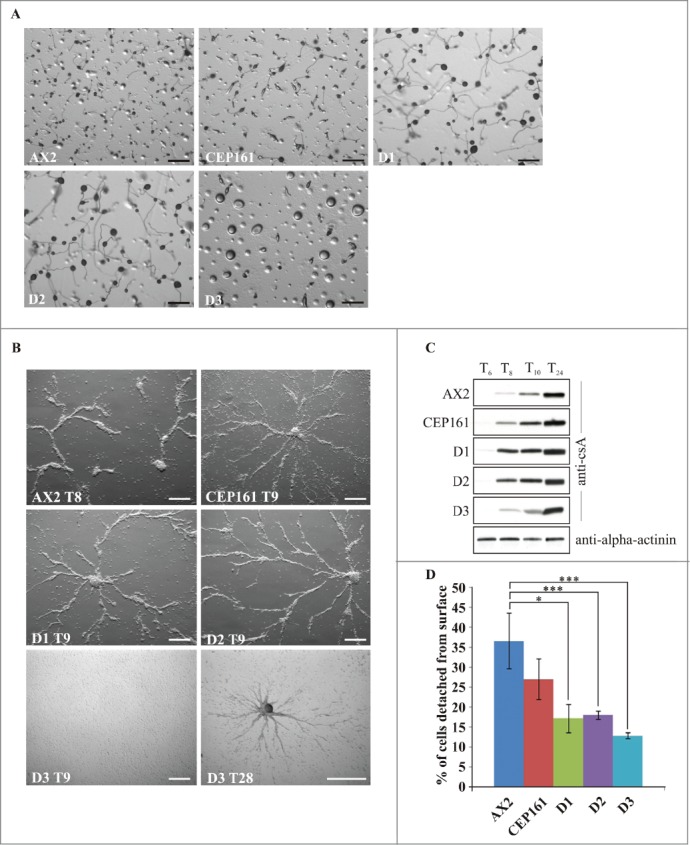
Figure 3.

CEP161 plays an important role in development. (A) Development of wild type and mutant cell strains on phosphate agar plates. Pictures were taken after 24 hours. Scale bar, 500 μm. (B) Stream formation on a plastic surface under phosphate buffer. The time points (in hours) indicate the occurrence of stream formation. Scale bar, 250 μm. (C) Expression of csA during starvation in shaken suspension. Cells were collected at the indicated time points and cell lysates analyzed by SDS-PAGE and western blot. csA was detected by mAb 33-294, mAb 47-16-1 detected α-actinin which was used as loading control. Since α-actinin blot was similar for all strains, only the α-actinin blot for AX2 is shown. (D) Cell-substrate adhesion. Percentage of cells detached from a plastic surface after shaking at 200 rpm for 1 hour. The symbol * indicates the significance of the p-Value. *<0.5, ***<0.001.
