
Figure 1.
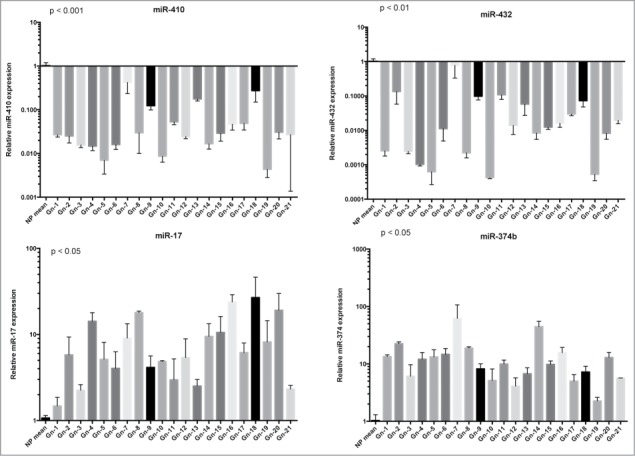
Validation of miRNA microarray data by qRT–PCR. qRT-PCR analysis of miR-410, miR-432, miR-17 and miR-374 expression in gonadotroph pituitary adenomas. The relative expression values indicate the relative change in the expression levels between 21 gonadotroph adenoma vs. the mean of tree normal pituitary samples. Each bar represents the mean value ± S.D. from independent experiments performed in triplicate. Asterisks indicate statistical significance compared with control cells.