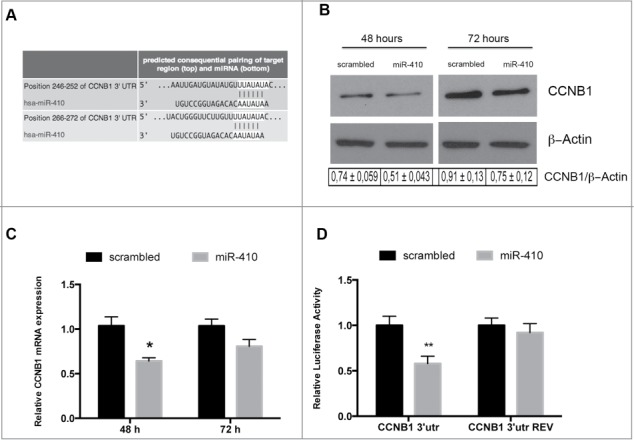
Figure 3.

miR-410 targets CCNB1. (A) Representation of human CCNB1 3′-UTR and the relative position of the predicted miRNA-binding sites (http://www.targetscan.org) (B) Western blots analysis of the CCNB1 protein expression level in HEK-293 cells transfected with miR-410 or a scrambled oligonucleotide and collected at 48 and 72 hours after transfection. β-actin expression was used for normalization control. The densitometric analysis was performed using ImageJ software and normalizing to β-actin. (C) qRT–PCR analysis of CCNB1 mRNA in HEK-293 cells transfected and collected at the indicated times. Expression values indicate the relative change in CCNB1 mRNA expression levels between miRNA-treated or scrambled oligonucleotide-treated, normalized with G6PD, assuming that value of the scrambled oligonucleotide-treated sample was equal to 1. The error bars represent the mean value ± S.D. *p<0,05 compared to scrambled oligonucleotideo-transfected cells using Student t-test analysis (D) Relative luciferase activity in HEK-293 cells transiently transfected with Luc-CCNB1–3′UTR or with Luc-CCNB1–3′UTR-REV along with miRNA-410 or scrambled oligonucleotide. The relative activity of firefly luciferase expression was standardized to a transfection control, using Renilla luciferase. The scale bars represent the mean ± S.D. of at least three independent experiments performed in triplicate. **p < 0.01 compared to scrambled oligonucleotide-transfected cells.
