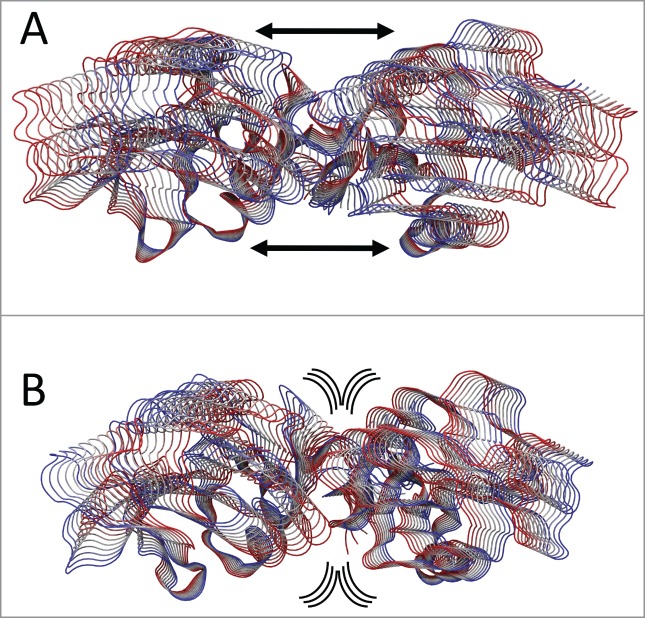
Figure 7.

PCA analysis. Tube representation of the motion projections along the first eigenvector for (A) CTLD in LOX-1.apo and (B) CTLD in LOX-1.lig. The direction of the subunits motion is indicated by the black arrows and by the flanked tubes, the vs. being defined from red to blue. Arrows underline the direction of the motion. This picture has been produced using the program VMD.47
