
Figure 3.
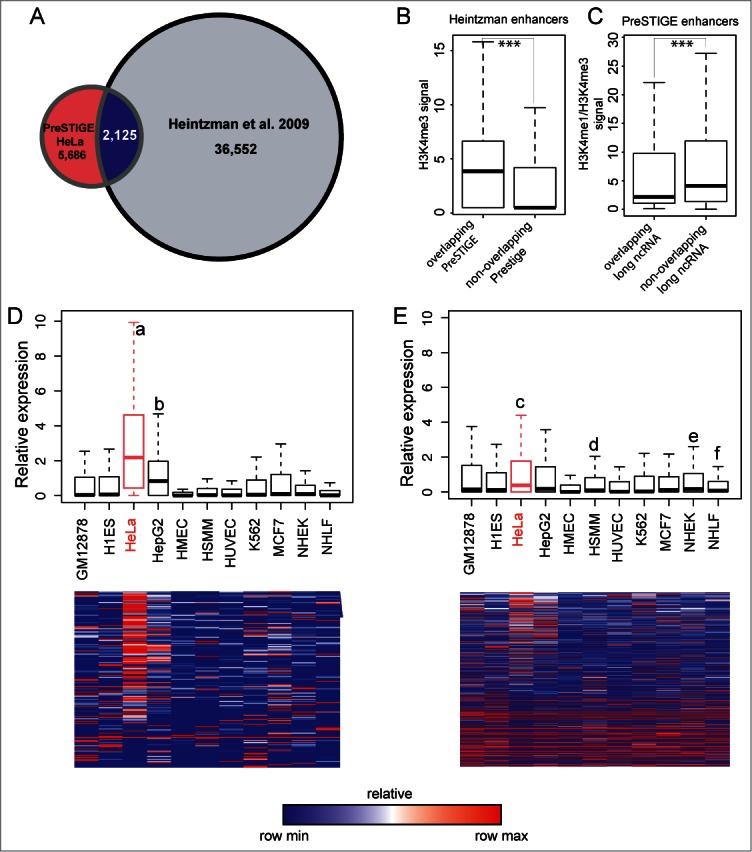
Comparison of PreSTIGE predicted enhancers to previous methods. (A) Venn diagram showing the overlap between enhancers in HeLa predicted by7 using H3K4me1 and H3K4me3 profiles compared to HeLa tissue-specific enhancers predicted by PreSTIGE. (B) Quantification of H3K4me3 at enhancers predicted by7 overlapping or not overlapping PreSTIGE predicted enhancers, respectively. *** P-value < 2.2e-16. (C) The ratio of H3K4me1 to H3K4me3 for PreSTIGE predicted enhancers overlapping or not overlapping a long ncRNA, respectively. *** P-value 0.00039. (D and E) As in Figure 2. Shown are average relative expression values across 11 cell lines for all long ncRNAs overlapping predicted enhancers in HeLa cells as bar-plots (upper panels) or heatmaps (lower panels). (D) Expression at enhancers predicted by the modified PreSTIGE method. a P-value < 2.2e-16, b P-value 9.0e-10. (E) Expression at enhancers predicted by Heintzman et al., 2009. c P-value 9.5e-07, d P-value 3.9e-05, e P-value 6.4e-06 and f P-value 1.6e-06. Statistical analyses were done using Mann-Whitney-Wilcoxon test.