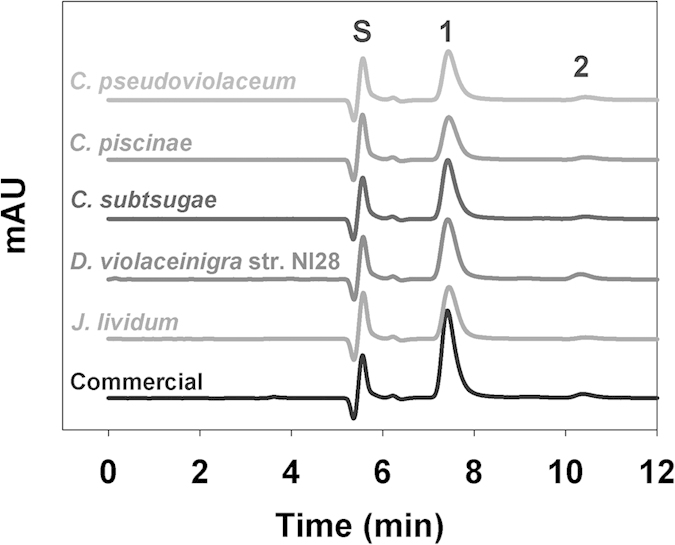
Figure 1. HPLC analysis of the violacein extracted from cultures of D. violaceinigra str.

NI28 and several of the strains employed in this study, showing the presence of violacein (Peak #1–7.5 min) and a second peak (Peak #2–10.3 min) that is presumed to be deoxyviolacein. The solvent front (Peak S) is seen at 5.4 min. A plot generated using a commercially available violacein extracted from Janthinobacterium lividum is also provided for comparison and includes both Peak #1 and Peak #2.
