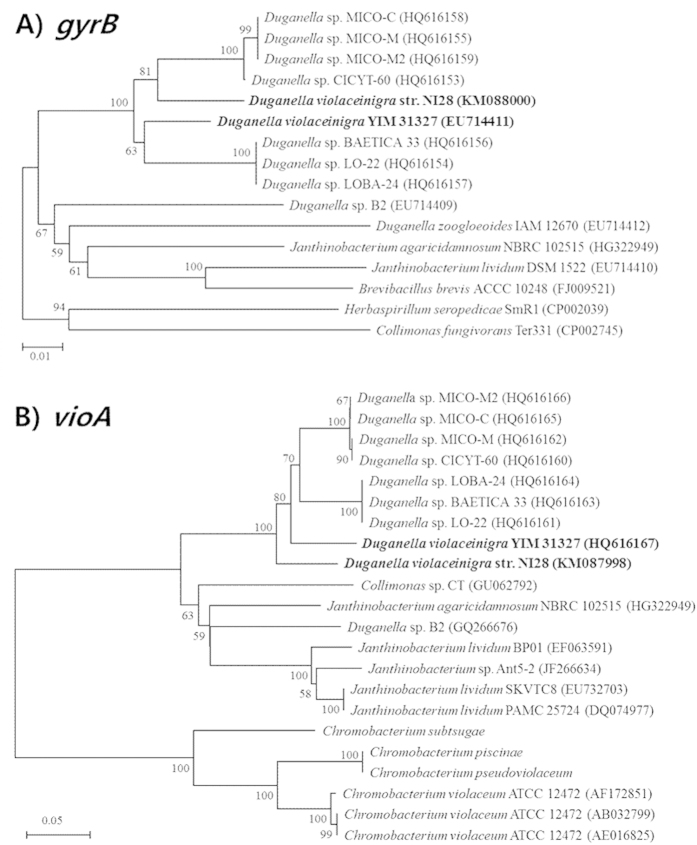
Figure 3. Phylogenetic analysis of the new isolate using the (A) gyrB and (B) vioA gene sequences.
The numbers at nodes indicate levels of bootstrap support (%) based on 1,000 resampled dataset. The bars corresponds to 0.01 or 0.05 substitutions per nucleotide. The nucleotide sequence accession numbers of the corresponding strains are listed in theparentheses.

