Figure 1.
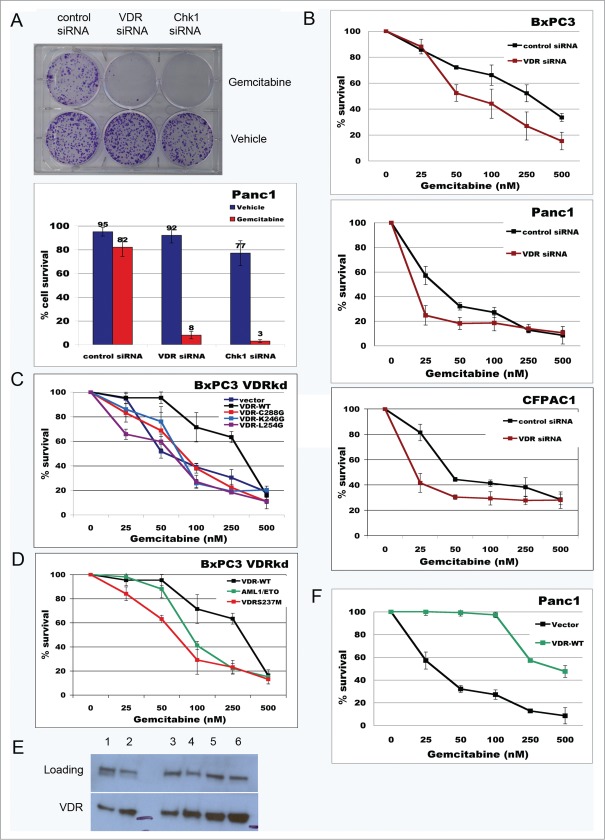
For figure legend, see page 3843.Figure 1 (See previous page). Sensitization of pancreatic cancer cells to gemcitabine following VDR knockdown. (A) Colony formation assay comparing gemcitabine sensitivity of Panc1 cells after control, VDR and Chk1 siRNA transfection. Cells were treated with 50nM gemcitabine for 24 hrs. and drug removed before the asssay. Colony counts are presented beneath the image of a representative colony survival assay. (B) Gemcitabine kill curves from clonogenic survival assays performed on BXPC3, Panc1 and CFPAC1 cells following control or VDR siRNA transfection (n = 5). p values: BxPC3 = 0.036, Panc1 = 0.171, CFPAC1 = 0.083. (C) clonogenic survival assays of gemcitabine sensitivity of BxPC3 VDRkd cells transfected with the indicated VDR constructs (n = 5). p values: VDR-WT = 0.088, VDR-C288G = 0.671, VDR-K246G = 0.845, VDR-L254G = 0.148. (D) AML1/ETO and VDR-S237M neutralizes the ability of WT-VDR to rescue gemcitabine resistance of BxPC3 VDRkd cells (n = 5). p values: AML1/ETO = 0.147, VDR-S237M = 0.039. (E) Western blot showing VDR expression after 18 hour vehicle or gemcitabine (50 nM) treatment of PCa cell lines. 40μg of protein loaded. Lane 1 = Panc1 + Vehicle; Lane 2 = Panc1 + gemcitabine; Lane3 = CFPAC1 + Vehicle; Lane 4 = CFPAC1 + gemcitabine; Lane 5 = BxPC3 + Vehicle; Lane 6 = BxPC3 + gemcitabine. The 55 kDa marker is labeled between lanes 2 and 3, and to the right of lane 6. (F) Increased resistance of Panc1 cells to gemcitabine following VDR overexpression (n = 5). p value = 0.008.

