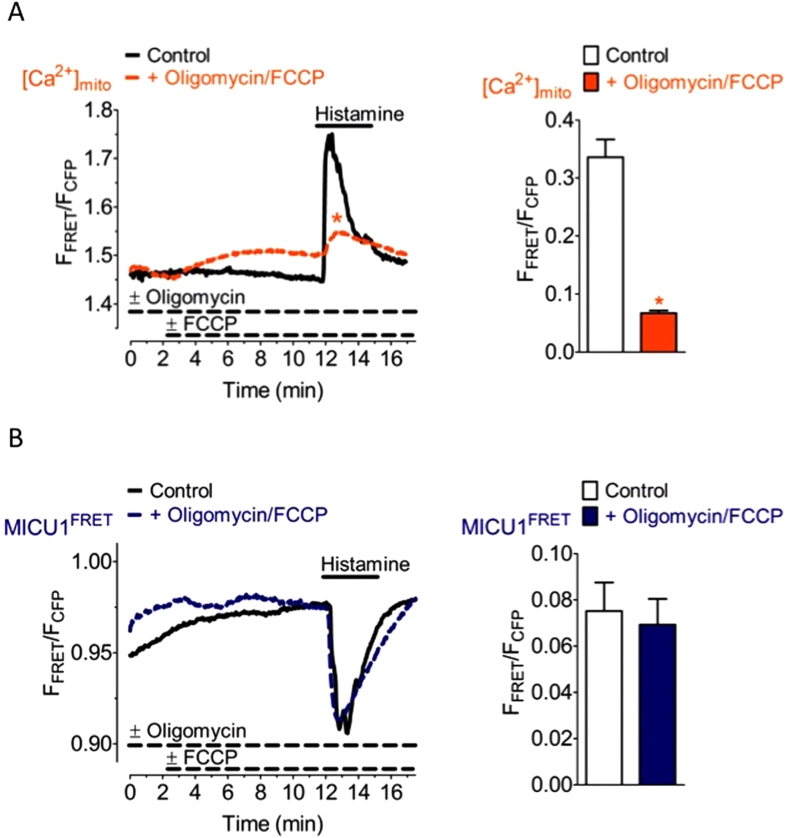
Figure 3. The Ca2+-induced rearrangement of MICU1 multimers is independent of Ψmito.
(A) Average curves reflecting mitochondrial Ca2+ signals over time of HeLa cells expressing 4mtD3cpv upon cell treatment with 100 μM histamine in the absence of extracellular Ca2+ under control conditions (black curve, n = 10) and in the presence of 2 μM oligomycin and 4 μM FCCP (orange curve, n = 14). Bar graph shows respective maximal ∆ ratio signals; mean ± SEM. *P < 0.05 vs. control. (B) Average MICU1 FRET ratio signals of HeLa cells co-expressing MICU1-CFP and MICU1-YFP in response to 100 μM histamine in Ca2+-free conditions in the absence of oligomycin and FCCP (control, black curve, n = 3) and the presence of 2 μM oligomycin and 4 μM FCCP (blue curve, n = 6). Bar graph shows respective maximal ∆ MICU1 FRET ratio signals; mean ± SEM.

