
Figure 3.
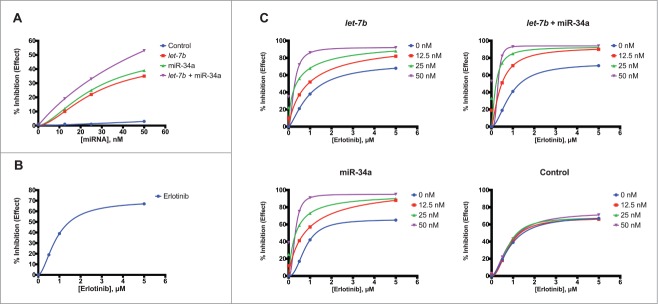
Dose-response analysis of let-7b and miR-34a in combination with erlotinib in H358 cells. (A) H358 cells were transfected with a control mimic, mimics of let-7b, miR-34a, or a half dose of each let-7b + miR-34a over a range of concentrations (12.5 nM to 50 nM). Five days after transfection, cell survival was determined using the sulforhodamine-B (SRB) assay. Curves representing % inhibition of cell proliferation relative to untransfected cells for each miRNA mimic were constructed using the Hill slope equation. Plotted data points represent the mean of 3 replicates. (B) H358 cells were treated with erlotinib over a range of concentrations (0.5 μM to 5 μM) 4 d after seeding. 72 hours after erlotinib treatment, cell survival was determined using the SRB assay. A curve representing % inhibition of cell proliferation relative to cells treated with DMSO as a vehicle control was plotted using the Hill slope equation. Plotted data points represent the mean of 3 replicates. (C) H358 cells were transfected with control mimic, mimics of let-7b, miR-34a, or a half dose of each let-7b + miR-34a at 3 concentrations (12.5 nM, 25 nM, 50 nM), or left untransfected. Two days after transfection, cells were treated with erlotinib in a serial dilution (0.5 μM to 5 μM). Cell survival was determined using the SRB assay 72 hours after erlotinib treatment. Curves representing % inhibition of cell proliferation relative to untransfected cells treated with DMSO as a vehicle control were constructed for each mimic treatment using the Hill slope equation. Plotted data points represent the mean of 3 replicates.