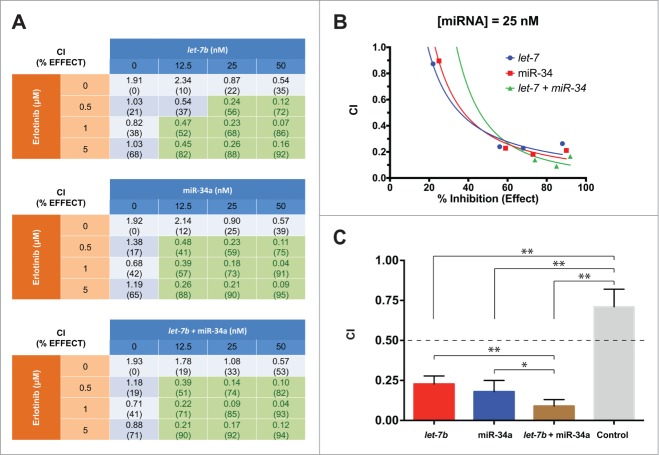
Figure 4.
let-7b and miR-34a synergize with erlotinib in H358 cells. (A) Tables showing combination index (CI) values and % inhibition of cell proliferation (relative to untransfected cells) for H358 cells transfected with let-7b, miR-34a, or half dose of each let-7b and miR-34a, and treated in combination with erlotinib at various concentrations. Reported CI values represent the average of 3 replicate experiments. Cells highlighted in green have CI values smaller than 0.5, indicating strong synergy. (B) Combination index plots of for H358 cells treated with miRNA mimics at 25 nM in combination with erlotinib at concentrations from 0 μM to 5 μM. (C) Bar graph indicating the CI values for H358 cells treated with a control miRNA mimic, or mimics of let-7b, miR-34a, or a half dose of each let-7b and miR-34a at 25 nM, and erlotinib at 1 μM. The dashed line indicates CI = 0.5 as a threshold indicating strong synergy. Plotted: mean ± s.d.; n = 3 ; *P < 0.05, **P < 0.01, Student's t-test.

