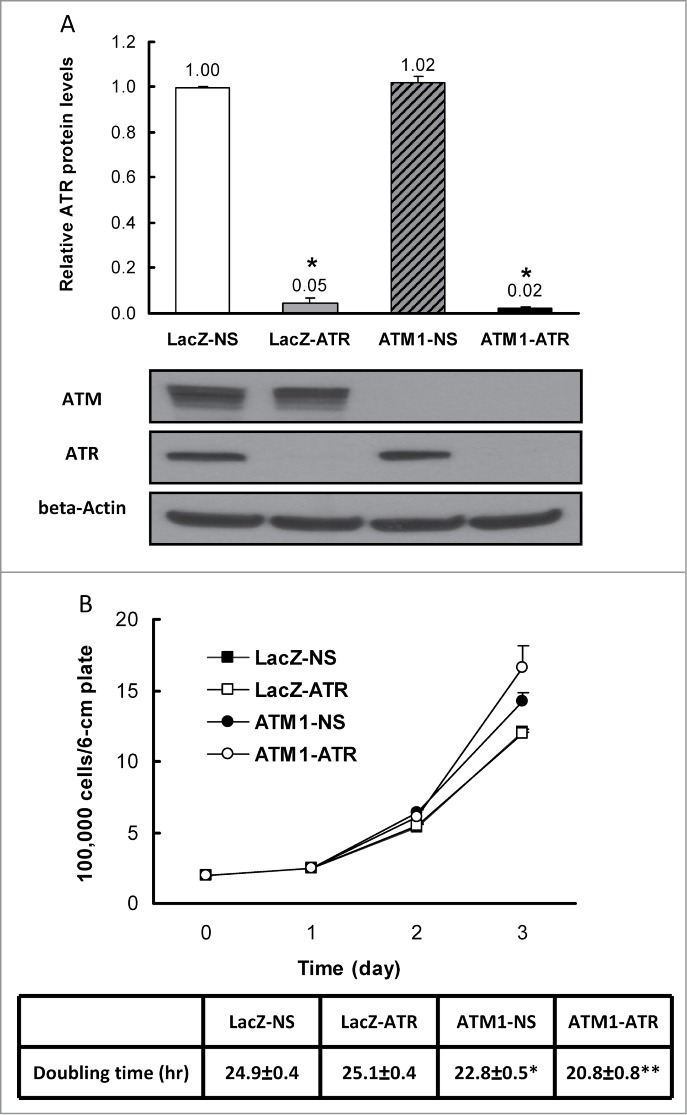
Figure 1.

Validation of ATR depletion in HME-CCs and characterization of cell proliferation. (A) Quantification of ATR expression in HME-CC cell lines with representative protein gel blots. Whole cell extracts were used and results are presented in mean Relative ATR Protein Levels ±SE (n = 3). *indicates significant difference compared to LacZ-NS (P < 0.05). (B) Cell proliferation and doubling times of wild-type HME-CC (LacZ-NS) and HME-CCs deficient of ATR (LacZ-ATR), ATM (ATM1-NS) or both (ATM1-ATR). The doubling time for each cell line is displayed as mean Doubling time±SE (n = 3). *compared to LacZ-NS (P < 0.05); **compared to ATM1-NS (P < 0.05).
