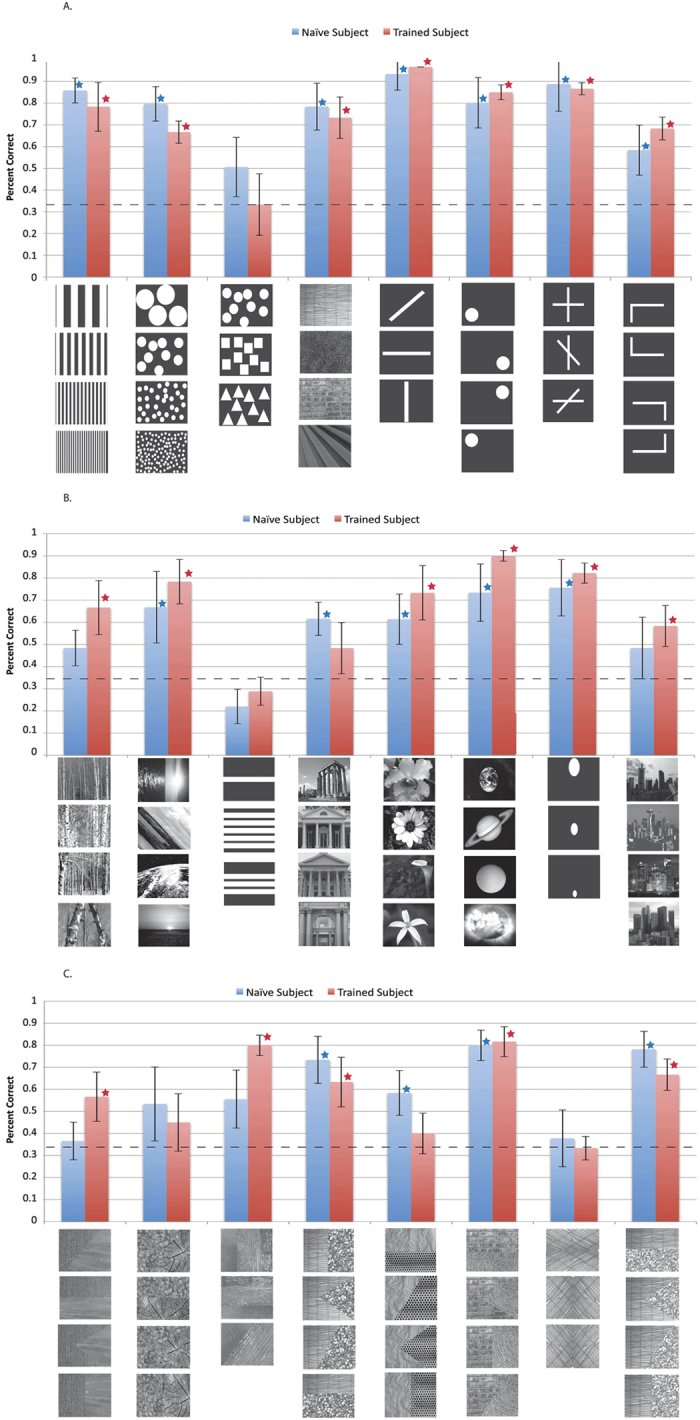
Figure 3. Data from images encoded into vOICe sounds and tested on sighted naive (N = 5 to 7) and trained participants (N = 5). Audiovisual (AV) matching experiment data for all images used are displayed (images beneath each vertical bar).

The dashed line indicates chance and the error bars represent standard deviation. The Blue bars represent the naive data and the red bars represent the trained data. In addition, red stars indicate that the trained subjects performed significantly better than chance (p < 0.002, with Bonferroni multiple comparisons correction), and the blue stars indicate that the naive subjects performed significantly better than chance (p < 0.002). Image sources28,29,30,31,32,33,34,35,36,37,38,39,40,41,42,43,44,45,46,47,48,49,50,51,52,53,54,55 are referenced in the supplemental (Note: many of images shown are images similar to the experimental images, as the original images are restricted by copyright, all original images are also referenced in the supplemental and can be viewed here: http://neuro.caltech.edu/page/research/texture-images/). Note: Photos 23, 26, 28, 32, 48, and 49 courtesy of Morguefile.com, under the general Morguefile license (www.morguefile.com/license)56.
