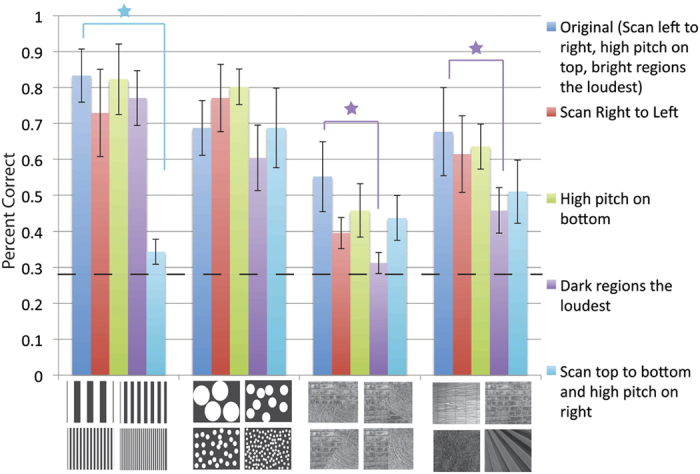
Figure 4. Data and images for matching sounds to images with alternative audio-to-visual (AV) mappings.

Naive participants (N = 8) matched images and sounds with alternative AV mappings; the original mapping is the vOICe encoding. The error bars represent the standard deviation across participants, and the dashed line represents chance. The stars indicate that the modified mapping is significantly different from the original mapping. Image sources28,29 are referenced in the supplemental (Note: A few of the images shown are images similar to the experimental images, as the original images are restricted by copyright, all original images are also referenced in the supplemental and can be viewed here: http://neuro.caltech.edu/page/research/texture-images/). Note: Photo 23 courtesy of Morguefile.com, under the general Morguefile license (www.morguefile.com/license).
