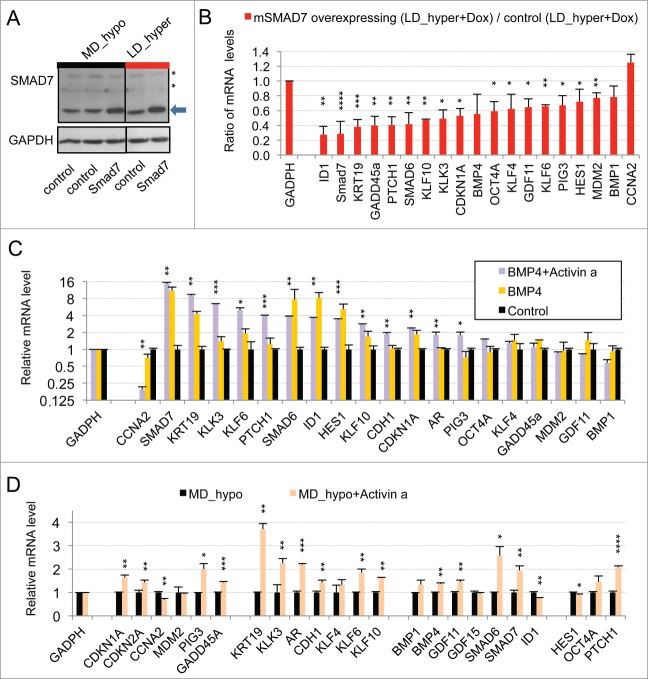
Figure 2.
Implication of SMAD signaling in LNCaP* dormancy. (A) Western Blot analysis of total smad7 expression (endogenous human SMAD7 and transduced murine Smad7) in cell populations transduced with pTRIP-control and pTRIP-mSmad7 cultured under exponentially growing (MD_hypo) or dormancy inducing (LD_hyper) conditions. Cells were grown in the presence of doxycycline to induce pTRIP expression and a polyspecific monoclonal antibody was used. The arrow indicates the common expected size for SMAD7 and Smad7 proteins (46 kDa) while a star indicates bands resulting from non-specific antibody hybridizations. Two identically processed parts of the same gel have been regrouped for the figure. (B) Regulation of mRNA species accumulation under dormancy-inducing conditions by ectopic Smad7 overexpression. Ratios of mRNA species levels measured by RT-qPCR between Smad7 and control-transduced cell populations cultured under LD_hyper conditions were derived from 2 couples of cell populations. Statistical significance of the effects of Smad7 overexpression is indicated. (C) Regulation of mRNA species accumulation by BMP4 and Activin α signaling in cells cultured under MD_hypo conditions. Relative mRNA levels determined by RT-qPCR were averaged with NAM (with levels under MD_hypo conditions taken as unity) from 2 and 4 independent pTRIP-BMP4 and pTRIP-control transduced cell populations respectively, cultured under MD_hypo conditions in the presence of doxycycline and activin α at 50 ng/ml as indicated. Statistical significance of the difference in mRNA levels between cells stimulated by BMP4 plus activin α and control cells is indicated. D) Regulation of mRNA species accumulation by activin α signaling in LNCaP* cells cultured under MD_hypo conditions. Relative mRNA levels were measured by RT-qPCR from 2 control and 2 treated cell populations respectively. Note that mRNA level of ID1, a target gene of BMP signaling, was decreased by activin α addition. Data are presented as mean ± s.d., with significance of mRNA levels variations indicated as in Figure 1.

