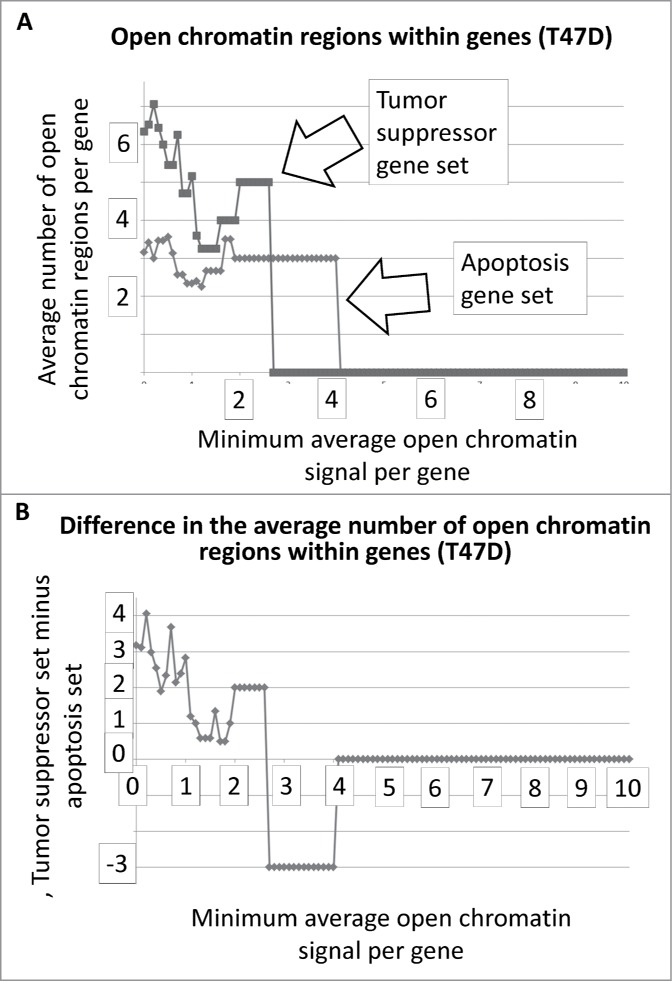
Figure 1.

Average number of open chromatin regions within tumor suppressor and apoptosis-effector genes as a function of the minimum average signal intensity for each gene set. The T47D cell line is shown as an example. As the minimum average signal intensity increases, genes are removed from the calculation of the average number of open chromatin regions. The Perl (version 5) code for this analysis is in the SOM of refs2,3. The outputted Excel files for all ENCODE cell lines available for this analysis are in the SOM.
