
Figure 1.
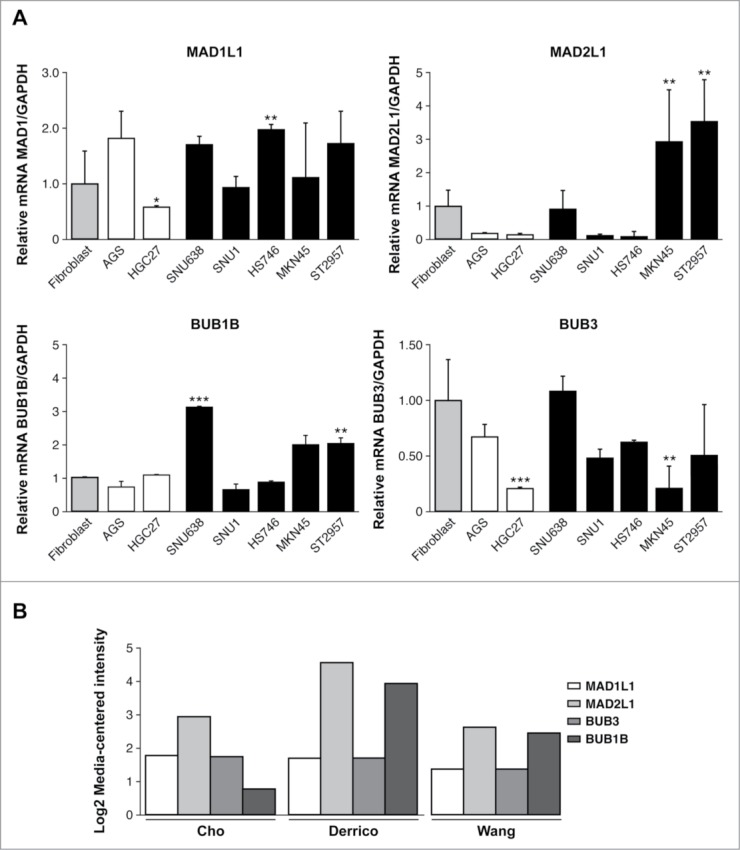
Relative levels of mRNA transcripts for the individual components of SAC. (A) Real-time q-PCR was performed to measure the relative levels of MAD1L1, MAD2L1, BUB1B, BUB3 mRNAs in the 7 GC cell lines established from primary tumor (white bars) and disseminated tumor (black bars). Each gene was normalized with GAPDH. Data are shown as relative to CCD18-Co, and the statistical significance was evaluated with ANOVA. ** P < 0.05 and *** P < 0.001. (B) Selected datasets from the Oncomine cancer microarray database were used to determine the alternations of MAD1L1, MAD2L1, BUB3 and BUB1B in mRNA expression levels. The graph represents the fold in gastric intestinal type adenocarcinoma versus normal gastric tissue based on studies reported by Cho et al., Derrico et al. and Wang et al. P < 0.001.