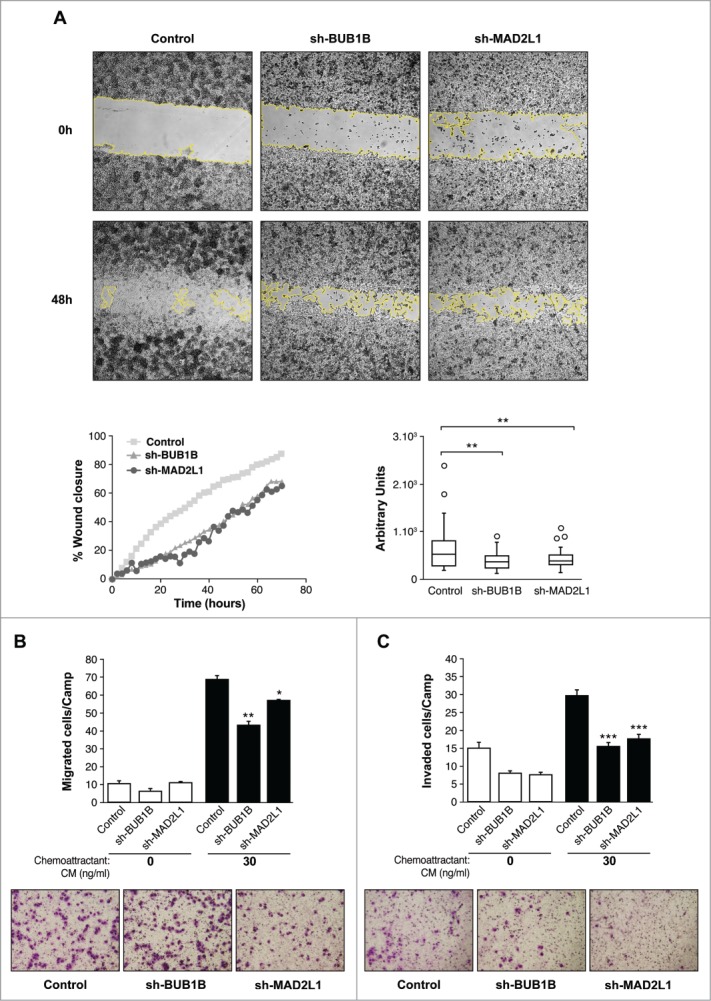
Figure 3.

Silencing of Mad2 and Bub1B reduces migration and invasion in MKN45 cells. (A) Representative images of the first (0 h) and last picture (48 h) of control MKN45, sh-Mad2L1 and sh-BUB1B cells taken during the wound healing experiment. Images were taken at 10× magnification, every 2 h for 48 h. The yellow line represents the wound border. Left panel: The graph shows the percentage of wound closure over the study time using the ImageJ program. Right panel: Assessment of speed variations within the interfered cell lines and the control. The table shows the average speed for each line. The experiment was performed twice, and statistical differences were assessed by one-way ANOVA (* P < 0.05, ** P < 0.005, *** P < 0.001). (B) Transwell migration assay. The graph shows the quantification of stained migratory cells using the transwell assay without chemoattractant (basal migration control) and 30 ng/ml chemoattractant presence at 24 h. Representative photographs of stained cells attached to the bottom membrane of a transwell at the bottom. Statistical differences were assessed by a one-way ANOVA (* P < 0.05, ** P < 0.005, *** P < 0.001) (C) Transwell invasion assay. Graph shows the quantification of stained invading cells using the transwell assay with 6 μg of Matrigel, without chemoattractant (basal invading control) and 30 ng/ml chemoattractant presence at 24 h. Representative photographs of stained cells attached to the bottom membrane of a transwell at the bottom. Statistical differences were assessed by one-way ANOVA (* P < 0.05, ** P < 0.005, *** P < 0.001
