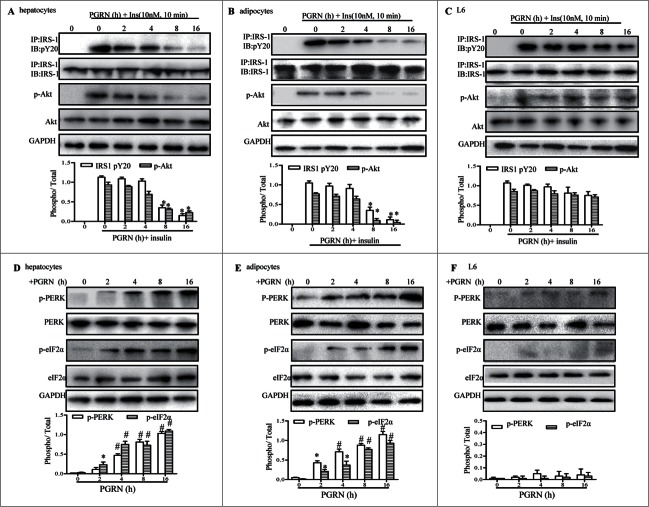
Figure 5.
Time course of the trigger of ER stress and the inhibition of insulin signaling in vitro. Cells were treated with or without 100 ng/ml PGRN at indicated times. The indicators of ER stress and insulin receptor signaling were measured at protein level. The relative quantity of proteins was analyzed using the Image J software. (A–C) The phosphorylation of IRS-1 and Akt in hepatocytes, adipocytes and L6 cells. (D–F) The phosphorylation of PERK and eIF2α in hepatocytes, adipocytes and L6 cells. A representative blot is shown and data expressed as means ± SEM in each bar graph represent the average of 3 independent experiments. *P < 0.05, #P < 0.01 (vs. cells at time point of 0 minutes).

