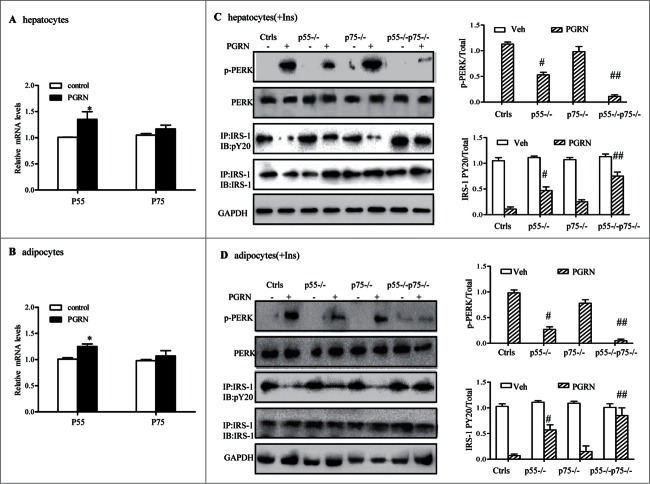
Figure 8.
Improvement of PGRN-induced ER stress and insulin-stimulated IRS-1 phosphorylattion by blockade of TNFR in vitro. WT and TNFR1/2−/- cells were treated with vehicle or PGRN (100 ng/ml) for 16 hr. For insulin signaling, cells were stimulated with 10 nM of insulin (Ins) for 10 minutes. Indicators of ER stress and insulin signaling were measured at protein levels. The relative quantity of proteins was analyzed with Quantity One software. (A, B) Relative expression of TNFR1 (p55) receptor and TNFR2 (p75) in hepatocytes and adipocytes treated with PGRN (100 ng/ml) for 16 hr normalized to β-actin (real-time PCR). (C, D) phosphorylated PERK, total PERK, phosphorylated IRS-1 and total IRS-1 of WT, p55−/−, p75−/−, and p55−/− p75−/− hepatocytes and adipocytes. The right is the quantification of proteins phosphorylation with normalization to total protein levels for each molecule under this condition. The data expressed as means ± SEM in each bar graph represent the average of 3 independent experiments. *P < 0.05 vs. vehicle. #P < 0.05, #P < 0.01 vs. PGRN. IB, immunoblotting; IP, immunoprecipitation.

