
Figure 4.
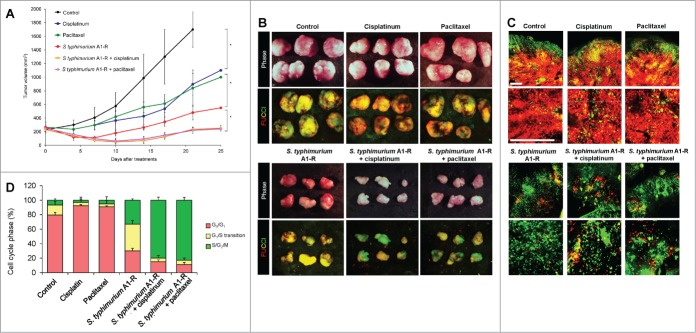
S. typhimurium A1-R-decoyed tumors became sensitive to chemotherapy. FUCCI-expressing MKN45 cells (5 × 10⁶ cells/mouse) were injected subcutaneously into the left flank of nude mouse. When the tumors reached approximately 8 mm in diameter (tumor volume, 300 mm3), mice were administered iv S. typhimurium A1-R alone, or with cisplatinum (4 mg/kg ip) or paclitaxel (5 mg/kg ip) for 5 cycles every 3 d. (A) Growth curves of tumors derived from FUCCI-expressing MKN45 cells after treatment with chemotherapy, S. typhimurium A1-R or in combination with S. typhimurium A1-R and chemotherapy. The difference between control and cisplatinum-treated: P < 0.01; the difference between control and paclitaxel-treated: P < 0.05; the difference between control and S. typhimurium A1-R: P < 0.05; the difference between control and the combination of S. typhimurium A1-R and cisplatinum: P < 0.01; the difference between control and the combination of S. typhimurium A1-R and paclitaxel: P < 0.01. (B) Macroscopic photographs of FUCCI-expressing tumors, untreated control, S. typhimurium A1-R-treated, cisplatinum-treated, paclitaxel-treated, or treated with the combination of S. typhimurium A1-R and either cisplatinum or paclitaxel (right). Scale bars, 10 mm. (C) Representative images of cross-sections of FUCCI-expressing MKN45 subcutaneous tumors, untreated control: S. typhimurium A1-R-treated, cisplatinum-treated, paclitaxel-treated, or treated with the combination of S. typhimurium A1-R and either cisplainum or paclitaxel. (D) Histogram shows cell cycle phase of FUCCI-expressing MKN45 subcutaneous tumors, including untreated control, S. typhimurium A1-R-treated, cisplatinum-treated, paclitaxel-treated, or treated with the combination of S. typhimurium A1-R and either cisplatinum or paclitaxel. Scale bars: 500 μm.