Figure 3.
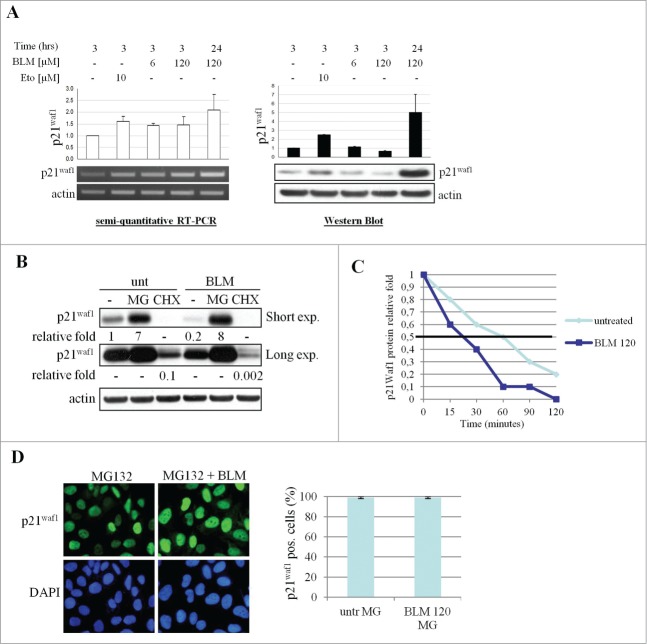
p21Waf1 downregulation is due to protein degradation. (A) p21Waf1 transcript and protein levels following BLM or Eto treatments were analyzed on the same U2OS samples by semi-quantitative RT-PCR and western blot. Relative quantification of band intensities was carried out considering the untreated sample as 1. The experiment shown is representative of 3 independent experiments. (B) U2OS were pre-treated for 30 min with 10 μM MG132 or 10 μg/ml cycloheximide (CHX) before addition of 120 μM BLM for 3 hrs. Total lysates were analyzed by protein gel blotting for p21Waf1. Relative quantification of band intensities, obtained by densitometric analyses normalized to actin loading is shown. (C) p21Waf1 protein half life was assessed in presence of CHX alone or CHX and 120 μM BLM. The data plotted in the graph were obtained by western blot and densitometric analysis of the bands. Untreated samples were considered as 1. (D) Immunofluorescence analysis of p21Waf1 protein localization in U2OS cells pretreated for 30 min with 10 μM MG132 and treated for 3 hrs with 120 μM BLM. Nuclei were visualized by DAPI staining. Data in the graph were obtained analyzing the microscope images as in Fig. 1B.

