
Figure 1.
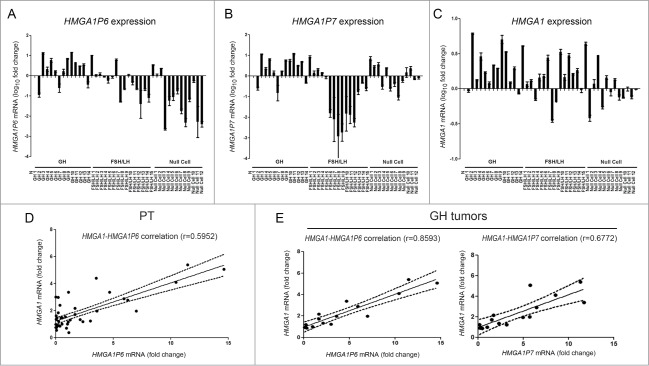
HMGA1 and HMGA1Ps expression positively correlates in pituitary tumors. (A) HMGA1P6, (B) HMGA1P7 and (C) HMGA1 qRT-PCR analysis in normal pituitary gland (N), GH, FSH/LH and null cell tumors. (D, E) The obtained values were then combined for correlation analysis. (D) Linear regression of HMGA1 versus HMGA1P6 in the whole series of PT. (E) Linear regressions of HMGA1 vs. HMGA1P6 (left panel) and HMGA1 (right panel) versus HMGA1P7 in GH tumors.