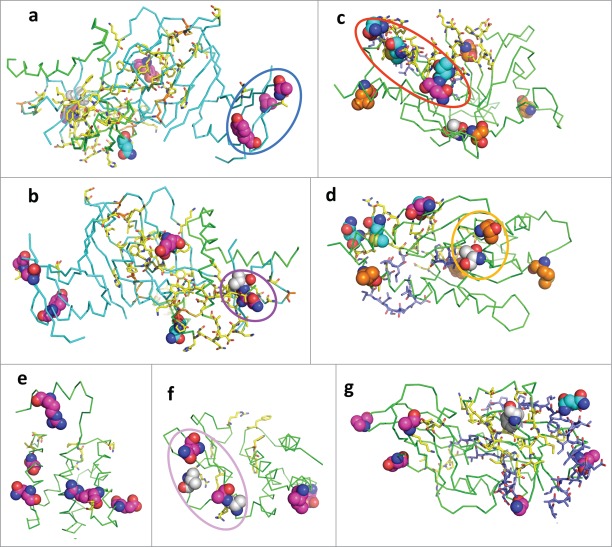
Figure 6.
Mapping of RESTV-specific residues, functional sites and interaction surfaces to known 3D structures of Ebolavirus proteins. The structure is shown in ribbon; the functional sites are shown as sticks; and positions with RESTV-specific mutations and alternate host (rodent) adaptation residues are shown as spheres. Carbon atoms of the functional sites and sites with RESTV-specific mutations are colored to show the property of that residue: RESTV-specific surface residues are in magenta; RESTV-specific buried residues are in white; RESTV-specific residues that belong to interaction surfaces are in cyan; known functional sites are in yellow; disulfide bonded and alternate host (rodent) adaptation residues are in orange; predicted functional residues are in blue. Other atoms are colored as follows: oxygen (red); nitrogen (blue) and sulfur (orange). Circles highlight clusters of RESTV-specific residues that are discussed in the text. (A, B) GP (PDB id: 3CSY); (C, D) VP24 (PDB id: 4U2X); (E) VP30 (PDB id: 2I8B); (F) VP35 (PDB id: 3L26); (G) VP40 (PDB id: 1ES6).

