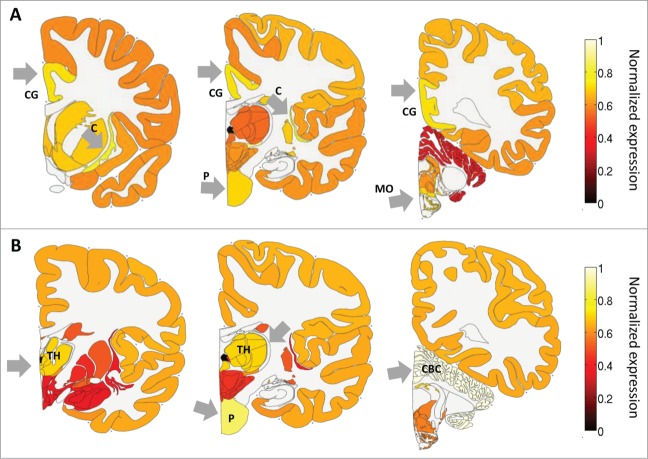
Figure 1.
ADAR and ADARB1 expression in the human brain based on the ABA-2013 data set. Heat map of normalized mRNA expression in 3 coronal slices of a human brain. Expression levels were calculated here by first summing expression over smaller regions, and then dividing by the maximum expression over regions, and averaged over 6 adult brains. This was done to allow easier visualization of the expression levels in the different brain regions. (A) ADAR expression is enriched in the cingulate gyrus - CG, the pons - P, the claustrum - C and the medulla oblongata - MO. (B) ADARB1 expression is enriched in the thalamus - TH), the pons - P and the cerebellar cortex - CBC. Figures were created using the brain-expression-visualizer tool available from www.chechiklab.biu.ac.il.

