
Figure 2.
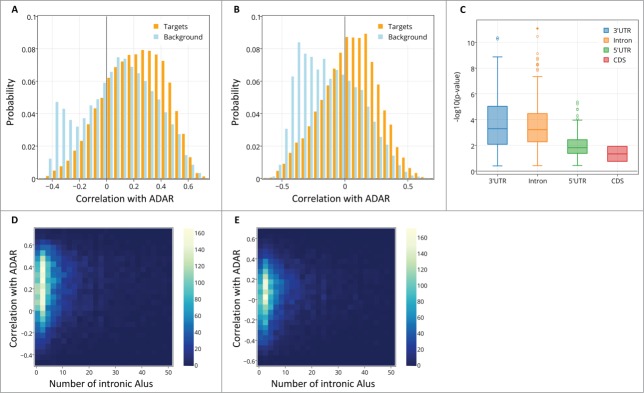
The distribution of spatial correlation values between ADAR and targets (orange) and between ADAR and a background set (light blue). The results are shown for (A) ABA-2013 dataset (B) Kang-2011 data set. The two distributions differ due to 2 groups of genes: a larger number of target genes have positive correlations with ADAR, and there also exist a group of genes that do not contain Alus, thus are not targeted by ADAR, but are strongly negatively correlated with ADAR. (C) Boxplot of the log-transformed p-values of a one-sided Wilcoxon test between ADAR correlations with targets vs. a background set of genes is plotted against the location of the Alu repeat pairs in the gene (note that Alu in the CDS or 5’ UTR is rare). P-values for the 2 datasets are pooled and shown together. Error bars encompass data within 1.5 times the inter-quartile range, and the boxes show the lower and upper quartiles together with the median. Outliers are represented as circles. Lack of differences in correlation between editing at the 3’ UTR and introns argues against global gene regulation by editing at the 3’ UTR. (D,E) 2D histograms of the correlation of genes with ADAR vs. the number of Alu repeats the genes contain. Positive correlation with ADAR increases with number of Alus. Points with more than 50 Alu repeats were ignored for easier visualization. The results are shown for (D) ABA-2013 data set (E) Kang-2011 dataset.