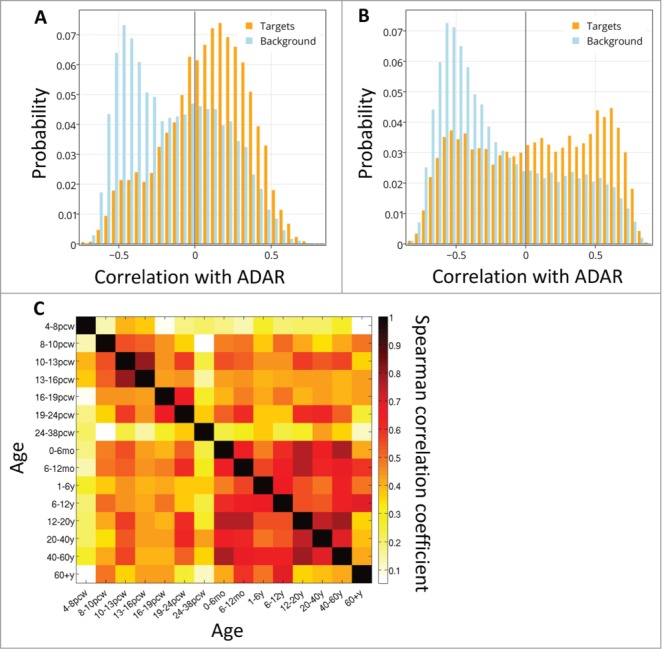
Figure 3.

ADAR-target correlations over development. The distribution of spatial correlation values between ADAR and targets with intronic Alus (orange) and between ADAR and a background set (blue), at 2 developmental time points: (A) 10-13 PCW and (B) 6-12 months. (C) Differential co-expression of ADAR and targets. Heatmap of Spearman correlation rho values showing the temporal cross-correlation between target gene lists ranked by their correlation with ADAR.
