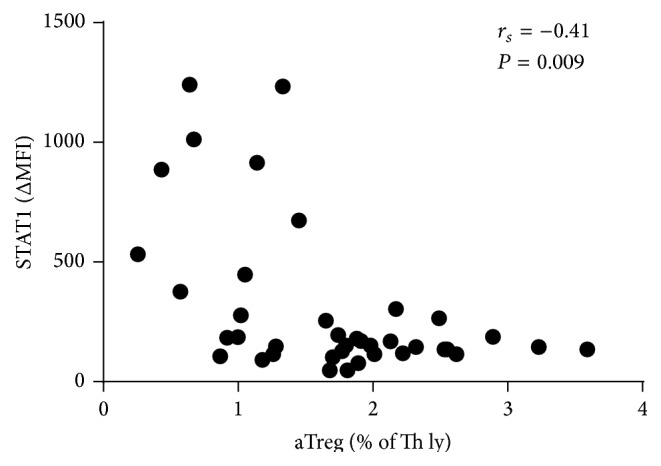
Figure 3.

Correlation between STAT1 expression in Th lymphocytes and percentage of aTreg in group containing children and adults. A significant negative correlation was found between STAT1 protein expression in Th lymphocytes and the percentage of aTreg lymphocytes (n = 40). Each symbol represents a single sample. A value of <0.05 was considered significant.
