
Figure 4.
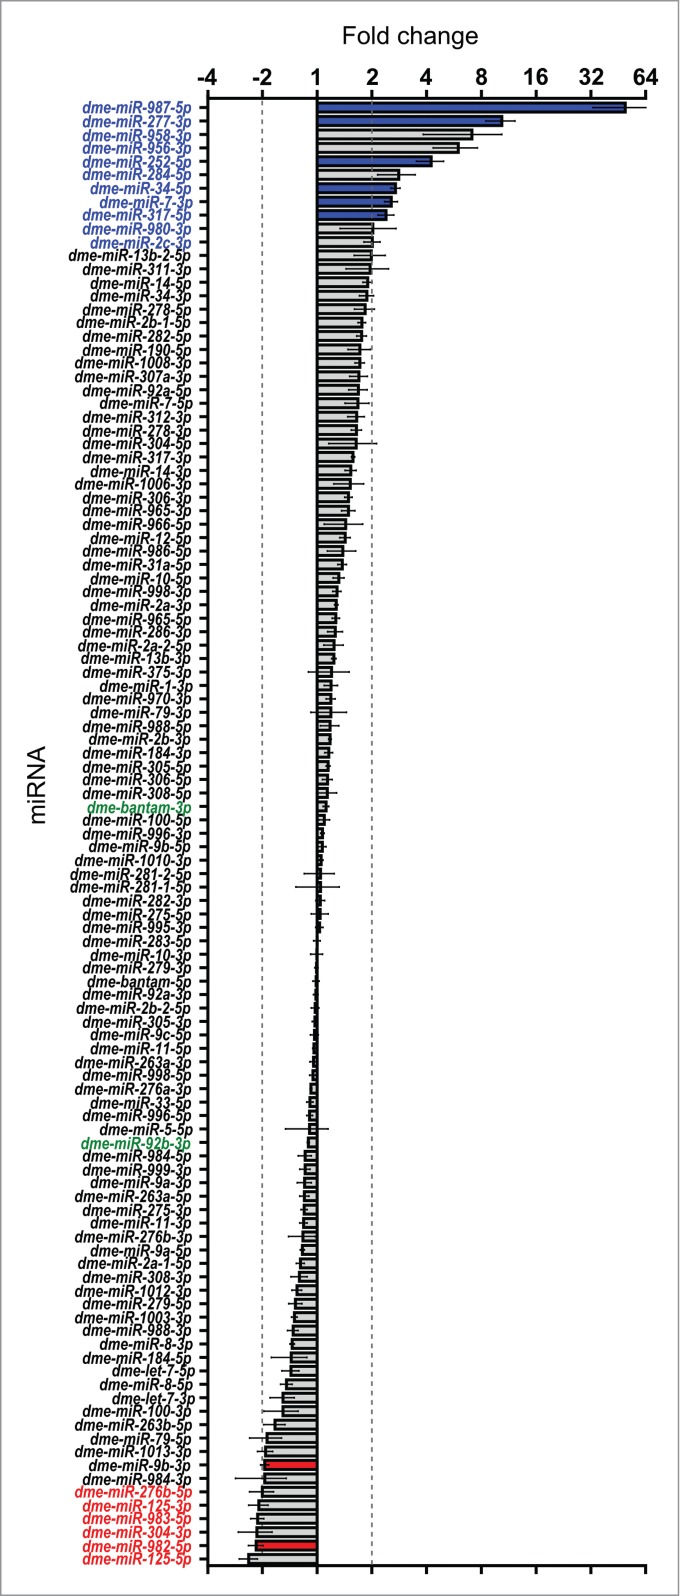
Effect of Dis3 knockdown on all wing imaginal disc miRNAs detected above threshold levels. Fold changes (Dis3KD vs grouped parental controls) from miRNA-seq data of the 109 detected miRNAs in the wing imaginal disc. miR-987–5p shows the greatest increase in expression (49.5-fold) while miR-125–5p shows the greatest decrease in expression (−2.4-fold). miRNAs that increase ≥2-fold are highlighted in blue font and those selected for further analysis are shown with blue bars. miRNAs that decrease ≥2-fold are highlighted in red font and those selected for further analysis shown with red bars. Selected miRNAs that remain unchanged are highlighted in green font. Dotted lines represent +/−2-fold changes. (n ≥2, error bars represent standard error).