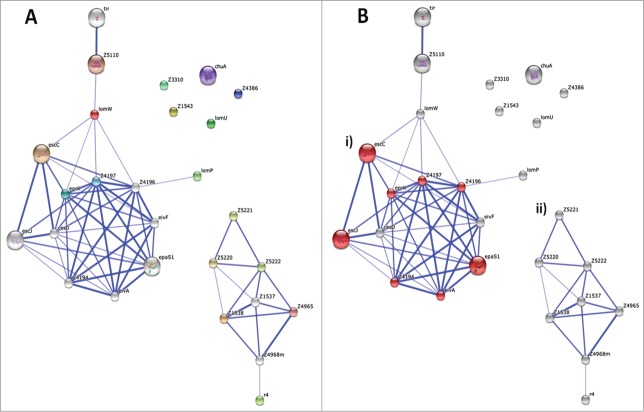
Figure 2.
Protein-protein interaction network of 17 HP proteins. (A) Using STRING database, network mapping was prepared. Thickness of line shows the confidence of the interaction. White nodes depict the added proteins by extended interactions. (B) Functionally enriched pathway ‘bacterial secreted proteins’ are shown by red color nodes, cluster (i). In the case of cluster (ii) this shows many fimbrial proteins. For 5 of HP proteins, no interaction could be obtained with high stringency.

