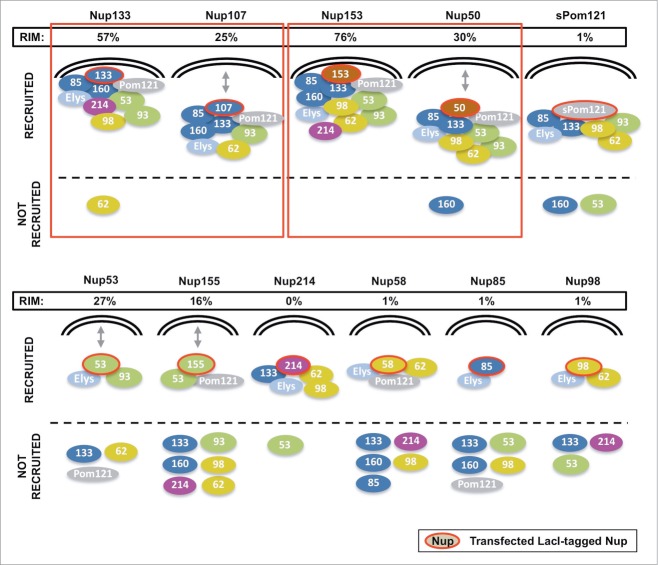
Figure 8.
A schematic summary of the recruitment and rim localization results for each LacI-CFP-Nup tested. The individual LacI-tagged Nup construct transfected (outlined in red) is indicated above each drawing. Endogenous nucleoporins tested that were recruited to the LacI-Nup/LacO array are shown above the dotted line, while the non-recruited Nups are shown below the dotted line. Nups belonging to the same subcomplex are in the same color (and correlate with the subcomplexes in Fig. 1A). Rim localization of the LacI-Nup/LacO array (% of cells) is denoted by close proximity of the recruited nucleoporins to the double nuclear membrane lines, and also by the % of cells that showed rim localization of the array (RIM: %). Double headed arrows indicate the Nups where the LacI-Nup/LacO array was found adjacent to the membranes, but in lesser percentages. A number of LacI-Nup/LacO arrays (sPom121, Nup214, Nup58, Nup85, and Nup98) showed essentially no rim localization. Red squares denote the members of the 2 subcomplexes that are able to initiate both extensive Nup recruitment to the array and rim localization of the array.

