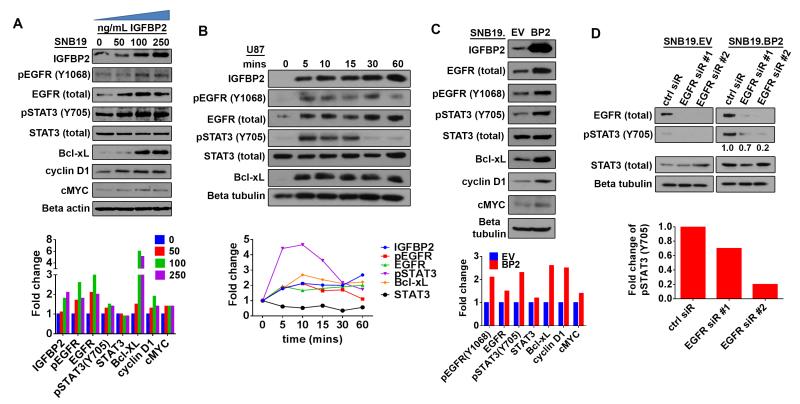
Figure 1. IGFBP2 activates STAT3 through EGFR.
(A) Immunoblot analysis of SNB19 cells starved of serum overnight then stimulated with exogenous IGFBP2 protein at the indicated dosages (0, 50, 100, 250 ng/mL) for 60 minutes. Densitometric analysis shown below the immunoblot indicates fold-change relative to unstimulated control cells (normalized to beta-actin loading control or total protein for phosphorylated proteins). (B) Immunoblot analysis of U87 cells starved of serum overnight then stimulated with exogenous IGFBP2 (100ng/mL) for the indicated time points (0, 5, 10, 15, 30, 60 minutes). Densitometric analysis shown below the immunoblot indicates fold-change relative to unstimulated control cells (normalized to loading control or total protein for phosphorylated proteins). (C) Immunoblot analysis comparing stable SNB19 empty vector cells (SNB19.EV) to SNB19 cells stably overexpressing IGFBP2 (SNB19.BP2). Densitometric analysis shown below the immunoblot indicates fold-change relative to SNB19.EV after normalization to beta-tubulin loading control (or total protein for phosphorylated proteins). (D) Immunoblot analysis comparing SNB19.EV and SNB19.BP2 cells depleted of EGFR via 2 independent pools of EGFR siRNA (EGFR sir#1, EGFR sir#2) to cells transfected with scrambled negative control siRNA (ctrl siR). The intensity of pSTAT3(Y705), quantified by densitometry, is shown below the immunoblot as fold-change relative to control siRNA, normalized to total STAT3.

